November 11, 2015
Mish's Daily
By Mish Schneider
US Home Construction as a concept is hardly a “wild thing” or something that should make one’s “heart sing.” Unless of course you are a contractor, seller of home improvement and construction supplies or, an investor in the ETF ITB.
I’ve been writing about ITB for some time now in the ETF section of my commentary below- “Has spent 6 weeks trading around converging moving averages-big move one way or another coming-26.50-28.00 range to break one way or another-big eyes here”.
Before I continue why I chose to comment on ITB and its gorgeous chart set up, I wish to address my subscribers to my discretionary trading account (Mish’s Market Minute Advantage).
I did not put this one in the portfolio but rather tweeted (and wrote about it) because the risk to the proper chart point-under 26.50, is well beyond our typical 1.5-2 ATR risk.
ATR-Average True Range or the average trading range of any instrument over the course of 3, 5 or 10 days.
I hope that some of you saw the tweet and followed if for the recommended more active trade. Here is the tweet if you missed it. @marketminute $ITB clearing the MAs. Risk/Reward best for active trade with quick exit if cannot close over 27.55
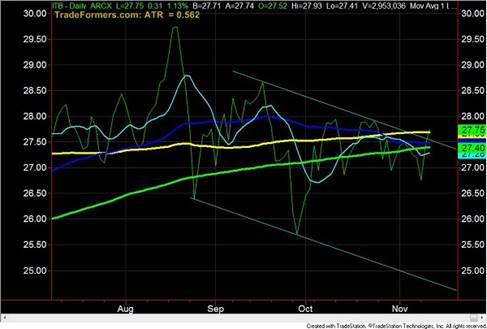
The above chart is ITB on a closing price basis. The yellow line is the 100 Daily Moving Average. The dark blue line the 50 DMA and the dark green line the 200 DMA. The cyan line is the 10 DMA.
Note for starters, how the moving averages are all converging between 27.20 and 27.70. Secondly, note that the trend lines I have drawn represent a channel using the closing prices.
Furthermore, note that with Wednesday’s close, ITB cleared both all the converging moving averages and broke the top of the channel trend line.
The risk for a long term swing trade should really be below the last swing low made on Monday at 26.52. However, from the breakout today over 27.55, that puts the risk at nearly 4 times the ATR.
Typically that means we are looking at a swing trade reward of 8 or more times the risk. That would mean a target of 31.50 area. Not since 2007 has ITB traded at those levels. Possible, but with current market conditions, would take patience and steely discipline to sit and wait for that. Of course, if not stopped out first.
That is why I like the active trade. That means one would have bought today over 27.55 with a risk to under 27.20 or a bit more than ½ the ATR. That also means that taking a partial profit on today’s rally to 27.90 (or an equal 1:1 risk/reward ratio) wasn’t so bad.
The stop moves up quickly to a no loss stop. The loss, if wrong, becomes negligible.
Welcome to the world of active trading in an uncertain market environment!
“Wild thing, I think you move me
But I wanna know for sure
Come on and hold me tight
You move me” –The Troggs
S&P 500 (SPY) 206.44 the 200 DMA to hold and 210 the resistance to clear
Russell 2000 (IWM) 114.70 is far but that is the 50 DMA. Also, back under the 65-week MA at 118.77. That would not be a good if it closes the week beneath there
Dow (DIA) 175.75 the 200 DMA with 178.00 the point to clear
Nasdaq (QQQ) Runaway gap low is at 112.07 and ultimately the point to hold. Over 114.50 better
XLF (Financials) Marginally held 24.50 with 24.25 the 200 DMA
KRE (Regional Banks) Broke the old 2015 high 45.62 and now if good must hold the runaway gap at 44.85 or higher
SMH (Semiconductors) 54.22 the 200 DMA pivotal and if cannot clear back over see 52.05 next
IYT (Transportation) 2 insides days-not surprising after Monday’s big move
IBB (Biotechnology) Range to break one way or another 324-340
XRT (Retail) Let’s see what happens at 44.00
IYR (Real Estate) Not as good as home construction but decent day over 73.40 with 74 to clear next
ITB (US Home Construction) Now, like to see this clear 28.00
GLD (Gold Trust) Unless this does the unusual and gaps and holds over 105, looks like all it did was work off oversold conditions and now can go lower still
SLV (Silver) If gets back over 14 then I would regain interest
GDX (Gold Miners) 2 inside days-interesting
USO (US Oil Fund) Broke 14.00 and now last nearest support at 13.61
TAN (Guggenheim Solar Energy) Note that Solar City might have had a reversal pattern from new lows
TLT (iShares 20+ Year Treasuries) Better if gets back over 119
UUP (Dollar Bull) 25.74 key to hold or could see some relief in instruments struggling against the strong dollar
EWG (Germany) Not a bad looking chart if holds 26.10

Every day you'll be prepared to trade with:


