June 26, 2017
Mish's Daily
By Mish Schneider
 Over the weekend, I picked a song for our crooning golden bull to sing- Johnny Mathis’ “Chances Are.”
As we continue to see the market wear a silly grin and come close to the highs yet fail to pierce them, I turn to another potential crooner.
Certain country funds have given investors huge profits.
In fact, MarketGauge’s country fund is up 221% over a ten year period beating by a factor of almost 7 times, the MCSI All-World Index.
This year, my Daily featured two different countries.
The first one I did was on Greece (GREK) when it was trading just under 8.00.
The second one was on India (IFN) when it was trading at 25.00.
Currently, GREK is trading at 9.88 and IFN at 27.29.
Neither look finished.
Now, I wish to highlight Brazil’s ETF EWZ.
What makes EWZ go walking that when it passes, each one it passes might go “A-a-ah?”
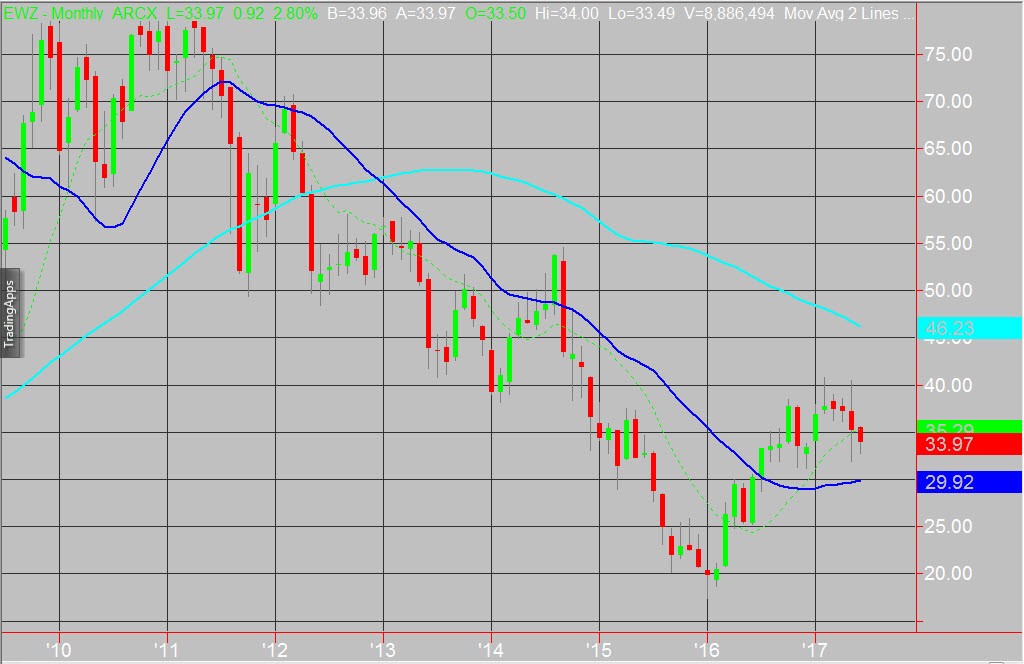
The chart of EWZ is the monthly timeframe.
The cyan line is the 80-month moving average.
The dark blue line is the 23-month moving average.
Like so many instruments, EWZ topped out in 2008 at 102.21.
Then, although it recovered back up to 80.00 during 2010-2011, once the 80-month MA broke in 2012, EWZ has traded well below Copacabana.
In 2016, EWZ recaptured the 23-month MA. Even though it traded up to 40.00 that’s still ½ of what the 2011 highs were and nearly a third of the 2008 highs.
Brazil is rich in raw materials. Brazil sadly, has also been rich in scandals. Two very real reasons the country ETF has had difficulty performing anywhere near what it did in its glory days.
We have seen commodities prices decline. Impact of scandals? Well, depends where you are these days.
June 2017 is trading inside the trading range of May 2017. 29.92-30.00 should prove to be long-term support.
Over 34.00, EWZ looks like a base is forming.
“Like a samba that swings so cool,” over 35.20, the technical picture improves.
Over 40.00, we will look at a test of the 80-month MA, a test that has not occurred since 2012.
At that point if you own some, when she passes, you will smile.
S&P 500 (SPY) Through 245 the rally continues. Under 242 suspicious. Under 240 even more so
Russell 2000 (IWM) 142.90 the number to watch. 140 pivotal. 137.50 support
Dow (DIA) Back through 214 would be better
Nasdaq (QQQ) 142.30 resistance. 140 support. Under 137.70 trouble
KRE (Regional Banks) Should this fail to retake 54, could see it follow Retails’ footsteps.
SMH (Semiconductors) 82.25 the 50 DMA. Has to clear 86.70.
IYT (Transportation) 170 pivotal 168 support then under 165 trouble
IBB (Biotechnology) 320 target reached. Could see more but I’d trail up a stop if long.
XRT (Retail) Closed over 40.00. Doubtful brick and mortar resurrecting. More likely that this is bargain hunters. 40.00 pivotal
IYR (Real Estate) Good breakout from a channel 81.00 support
XLU (Utilities) 52.65 the 50 DMA
GLD (Gold Trust) Like if holds 118 and clears 120
GDX (Gold Miners) Unconfirmed bearish phase. Couldn’t hold the 50-DMA but le’ts see what happens at 22.25
XME (S&P Metals and Mining) Warming up with today’s flat close
USO (US Oil Fund) Don’t see much yet after the big move down
TAN (Solar Energy) 19.19 should now hold if good
TLT (iShares 20+ Year Treasuries) 127.37 now support as it works above the old gap. Will see if it can get to 129.70 or not
UUP (Dollar Bull) 25.40 resistance and under 25.10 not so good

Every day you'll be prepared to trade with:


