August 16, 2022
Mish's Daily
By Mish Schneider
Written by Wade Dawson (Michele Schneider is away from the office)
Since mid-June, the stock market rally has gathered substantial traction regarding participation and market breadth, and there’s a good chance that most traders are focused on the wrong market.
Most traders are probably looking at the S&P 500 SPDR ETF (SPY) because that is the big one to watch, and…
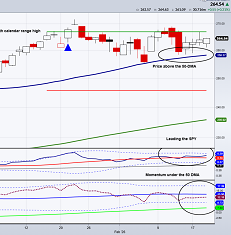
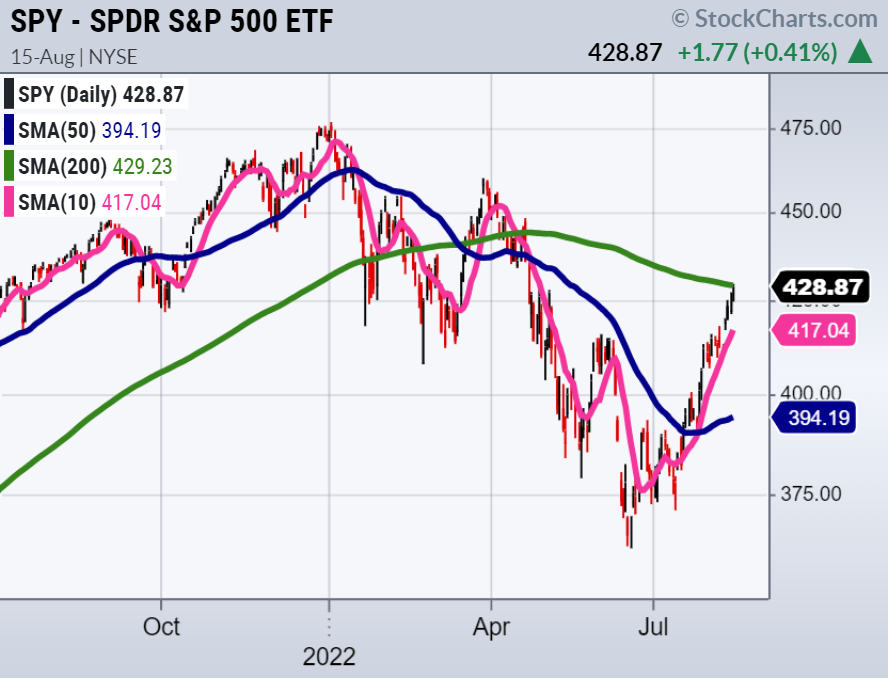
Since technical indicators are now indicating that SPY is close to regaining a price above the 200-day market average, denoted by the green line above.
The SPY closed on Monday at 428.87. The SPY is now up against the 200-day moving average, as seen above at 429.23. SPY's price has not exceeded the 200-day moving average since early April, so this is tough resistance.
The SPY has successfully pushed through several critical levels of resistance and continued to advance since mid June.
The 200-day moving average is an important indicator to assess whether there's been a longer-term change in the market. So SPY crossing this moving average will be a very bullish signal.
When trading only on this indicator, you must be cautious, but crossing it denotes that things are moving in the right direction.
SPY needs to re-claim the price above the 200-day moving average and hold this price level for a couple of days to declare technical success.
The SPY isn't the only index to pay attention to, and it's not even the most crucial index to follow right now if you want to know whether this rally will continue.
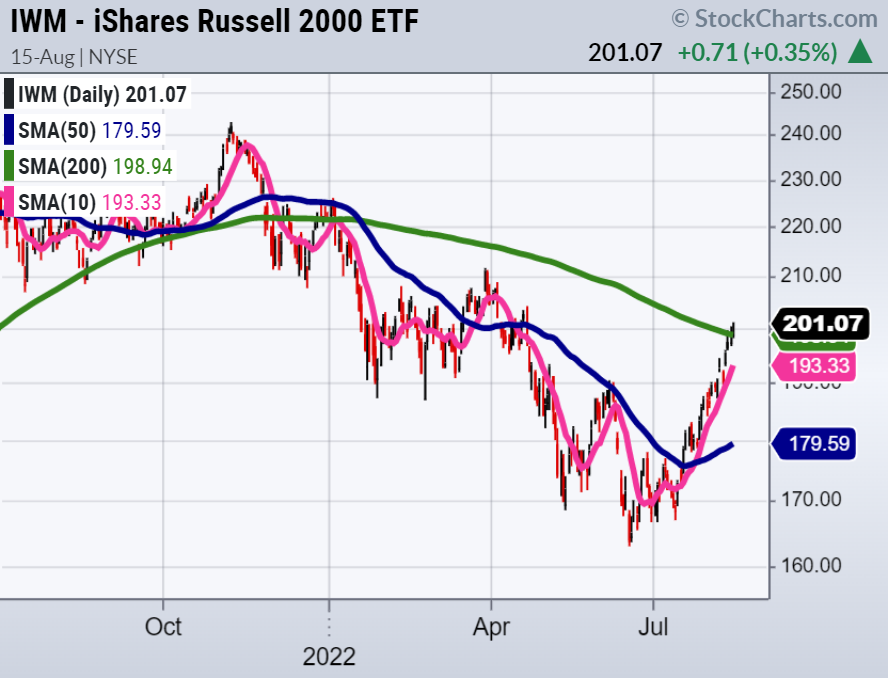
Looking at the Russell 2000 ETF, AKA "Grandpa IWM," you can see the Russell 2000 is leading this rally.
It is already above the 200-day moving average. Grandpa Russell looks stronger than SPY, and it is a bullish sign for the overall market as long as they both continue to rise.
Grandpa is still at risk for an exhaustion move if "Grandpa IWM" only kisses this technical level briefly and does not hold these price levels throughout the trading week.
So watch Grandpa IWM closely and its 200-day moving average. I'll be keeping a careful eye on the 200-day moving averages, but most closely on the Russell 2000, and I recommend you do too!
On the topic of the 200-day moving average, MarketGauge's president, Geoff Bysshe, discussed a wide range of trading topics last week with Mish's subscribers in live training.
He specifically addressed trading opportunities near the 200-day MA.
Such as:
If you’re a member and missed the live training, it is on video demand for all Mish's members.
If you’re not a member and would like learn more about membership please let us know via live chat, phone, email (all below), or book a private call /consultation with our Chief Strategy Consultant Rob Quinn by clicking here.

Fox-Making Money With Charles Payne 08-03-22
Trader Talks Biz First AM: Clover Health 08-03-22
Mish's midweek update: A trendsetting week in the markets Part 2 of 2 08-03-22
Bloomberg TV on Yields 08-02-22
Business First AM on ARKK 8-02-22
Cheddar TV on Big Tech 07-29-22
ETF Summary
S&P 500 (SPY) 429.23 now resistance with support at 427.67
Russell 2000 (IWM) 202.07 the resistance with support at 199.14
Dow (DIA) 340.79 resistance and support at 337.
Nasdaq (QQQ) 334.60 1st level of resistance and support at 330.05.
KRE (Regional Banks) 68.31 resistance, support level at 66.85.
SMH (Semiconductors) 248.45 resistance and support at 243.83.
IYT (Transportation) 248.83 resistance and support at 245.41.
IBB (Biotechnology) 135.85 resistance point and 132.45 is support.
XRT (Retail) 72 resistance point and with support is at 69.67.

Every day you'll be prepared to trade with: