April 26, 2016
Mish's Daily
By Mish Schneider
Motion has no “days-off.”
Motion cannot be created or destroyed. It “is” because motion is made up of matter. Matter is active. Matter is everything around us. It exists outside our consciousness. It is the only existing objective reality. It exists independently of human consciousness. *
If Motion is Matter, then Markets Are Matter in Motion
And that brings me to commodities.
Regrettably, I haven't collected the plethora of tweets and articles I've seen this year poo pooing the run in gold and other commodities. I don't mean for vindictive reasons. Rather, as examples of how little many traders know about what fuels commodities rallies.
Some recent posts about the record number of corn plantings, for example, that cite corn can only go in one direction-down. Or the at least 5 different calls for the top of gold I’ve seen in the last 2 months. What about oil and energy bears? “Oil will see $25 a barrel before it sees $40.” Oil today? $44.00 per barrel.
Then there’s the economists who crunch numbers and tell us global demand is still way down. Inflation is years away.
Why do commodities defy fundamentals and oftentimes logic?
The Matter of Motion!
If matter exists outside our consciousness, is all around us, is the only existing objective reality and exists independently of human consciousness, then
Hello world of commodities trading!
I can think of no better example of appearance/reality dichotomy than that of commodities trading.
And I oughta know-I lived/traded the better part of my youth watching gold, sugar, silver and oil rally independently of human consciousness.
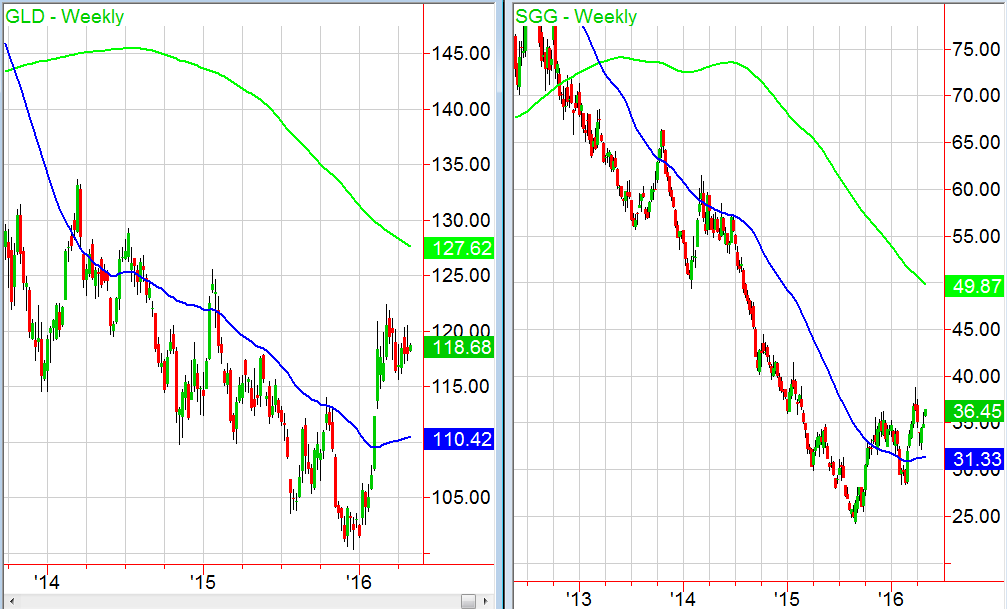
So forget the analysts and the fundamentals. Energy is motion, which is impossible without a material vehicle. In the case of the 2 charts above, that energy provider pushing the vehicle are the speculators.
The speculators are out of the equites markets in record numbers. Increasingly, speculators are turning to commodities.
I highlight gold and sugar weekly charts. Both had “death crosses” and began prolonged bear phases in 2013. Both are currently in Recovery Phases. Sugar started its ascent in the fall of 2015. Gold really got going the beginning of 2016.
Even if the stars above seem motionless to us, they are moving at colossal speeds. Einstein’s E=mc (2) says that as mass increases so does energy. *
*Dialectical Materialism (A. Spirkin)
S&P 500 (SPY) 206.84 point to hold. December high 211. Held the 10 DMA and had a Golden Cross
Russell 2000 (IWM) 112.25 the 200 DMA to hold. 13.20 daily chart support. Cleared The 50 week moving average at 114.40. Has to close the week above there.
Dow (DIA) 178 good support and 181.42 recent highs
Nasdaq (QQQ) 107.85 the 200 DMA
XLF (Financials) 23.25 the 200 DMA 23.78 fills a gap on the weekly charts
KRE (Regional Banks) Back above the 200 DMA for an unconfirmed accumulation phase. Weekly chart resistance at 41.08 to clear by Friday
SMH (Semiconductors) 55.66 point to clear and 54 point to hold
IYT (Transportation) Inside day. Needs to clear 148 hold 140
IBB (Biotechnology) 276 support to hold 290 point to clear
XRT (Retail) 45.60 the weekly MA to clear
IYR (Real Estate) 77.40 pivotal.
ITB (US Home Construction) 26.80 support
GLD (Gold Trust) Some see glass half empty-I see it half full.
SLV (Silver) I have no problem with this taking time to consolidate at higher levels
GDX (Gold Miners) This is what an orderly bull run looks like
USO (US Oil Fund) 10.80 cleared on a closing basis. Friendly
OIH (Oil Services) Held the 200 DMA again
XOP (Oil and Gas Exploration) Cleared the 50 week moving average and needs to stay there by the end of the week for next leg up
TAN (Guggenheim Solar Energy) Inside day and good volume
TLT (iShares 20+ Year Treasuries) 127 holding. Like TBTs over 38.85

Every day you'll be prepared to trade with:


