August 18, 2022
Mish's Daily
By Mish Schneider
Written by Wade Dawson (Michele Schneider is away from the office)
Stocks declined on Wednesday, with small caps and growth stocks selling off, but most stocks were down across the board.
Grandpa Russell "IWM" broke back below its 200-day moving average, and unsurprisingly the S&P 500 also closed below its 200-day moving average. Today, the S&P Index was one point away.
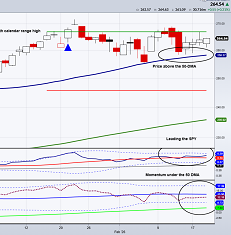
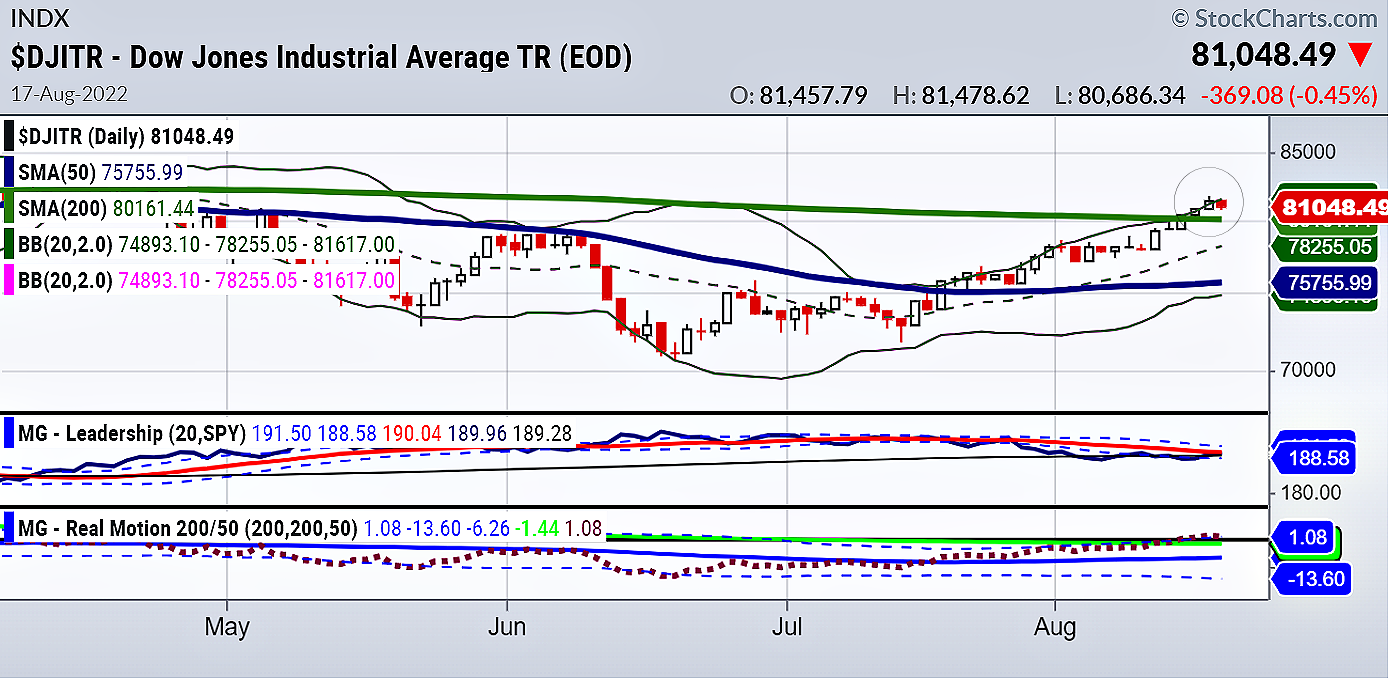
One index is marching on solo. The Dow Jones Industrial Average continues to rise above its 200-day moving average.
The S&P Index has been trading in a range between 4100 and 4200.
There are increasing odds that this rally will fail the longer the SPY ETF trades inside this band so watch carefully for a big break out or a potential drop.
If the present rally stalls in the upcoming days and weeks, value stocks may profit from any shift away from riskier assets.
Growth vs. Value
VTV / VUG (October 2021-August 2022)
Vanguard Value ETF (VTV) spread Vanguard Growth ETF (VUG)
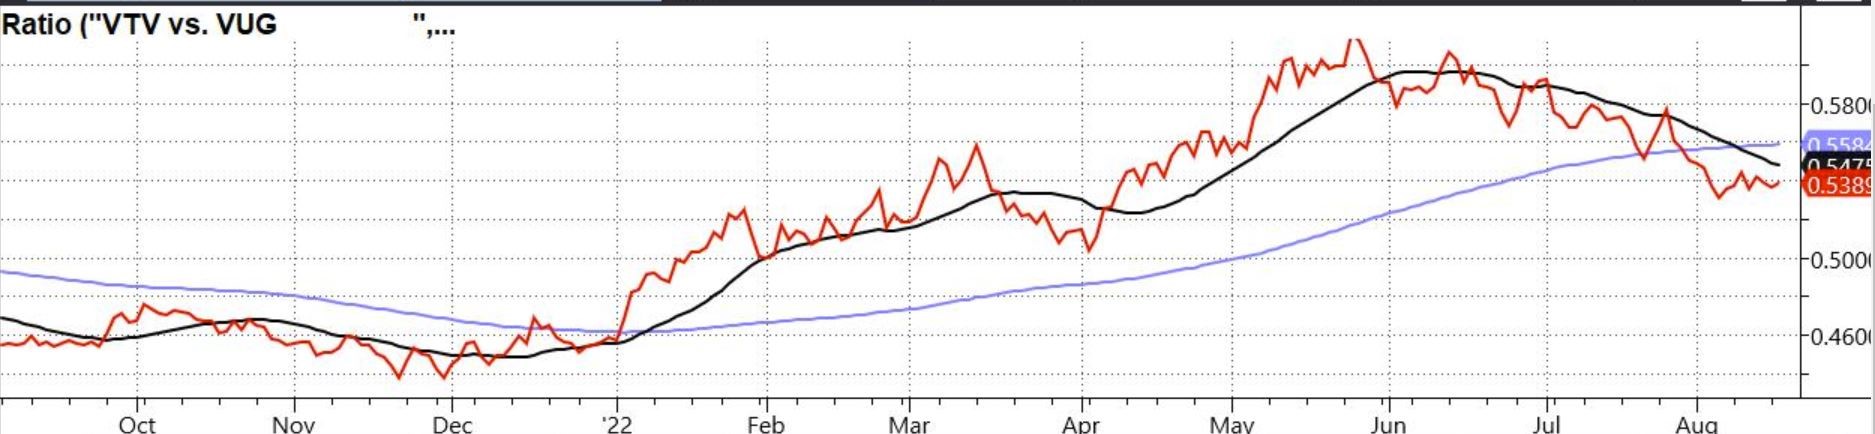
The above chart displays the value price ratio, or the price spread of value vs. growth since September 2021.
Growth has outperformed over the last several months and has been firmly in control, signaled by the red line moving down. The gap between growth and value has widened considerably since June 2022.
If this rally changes to the downside, we may continue to see a "greater rotation" into value-oriented assets, such as:
select retailers, re-opening trades, energy, grains, dividend-payers, low vol, fertilizers, renewables, chemicals, utilities, grains, metals, miners, healthcare, REITs, consumer staples, infrastructure, industrials, and insurance companies to name a few value areas.
Risk of Recession Is High
The risk of more than a technical recession is high because global growth is slowing, and several economic indicators are deteriorating.
Evidence of sustained economic weakness and headwinds seems to be everywhere…
Conclusion: The Fed is conflicted on what to do next because there are so many messages ahead. Companies are continuing to lay off employees, while Treasury yields are still inverted, and job positions remain unfilled. Stay vigilant in your risk governance.
Economic Modern Family Daily Snapshot
Grandpa Russell, IWM -1.68%
Sister Semiconductors, SMH -2.15%
Granny Retail, XRT -2.85%
Brother Biotechnology, IBB -1.95%
Tr., Transportation, IYT -1.64%
Son, Regional Banks, KRE -1.17%
Written by Wade Dawson, Portfolio Manager on behalf of:
Michele Schneider, Managing Director of MarketGauge and Director of Trading Education and Research at MarketGauge.com.
If you’re not a member and would like learn more about membership please let us know via chat, phone, email, or book a private call with our Chief Strategy Consultant Rob Quinn by clicking here.

Fox-Making Money With Charles Payne 08-03-22
Trader Talks Biz First AM: Clover Health 08-03-22
Mish's midweek update: A trendsetting week in the markets Part 2 of 2 08-03-22
Bloomberg TV on Yields 08-02-22
Business First AM on ARKK 8-02-22
Cheddar TV on Big Tech 07-29-22
ETF Summary
S&P 500 (SPY) 428.55 now resistance with support at 427.79
Russell 2000 (IWM) 198.68 the resistance with support at 198.21
Dow (DIA) 342 resistance and support at 341.07
Nasdaq (QQQ) 330.24 1st level of resistance and support at 329.73.
KRE (Regional Banks) 67.82 resistance, support level at 67.30.
SMH (Semiconductors) 239.46 resistance and support at 238.35.
IYT (Transportation) 246.31 resistance and support at 245.35.
IBB (Biotechnology) 131.99 resistance and 131.02 is support.
XRT (Retail) 72.99 resistance point and with support is at 71.95.

Every day you'll be prepared to trade with: