October 14, 2025
Mish's Daily
By Mish Schneider
In this, my last Daily until I return from a trip to NY (see media schedule below), India and the India Country Fund INDA, has captured my attention.
Here are four reasons we have eyes here.
Rare Earth Minerals.
India holds a substantial amount of reserves, along with being a significant producer.
India falls 5th in mineral reserves although with a relatively big gap of its reserves versus the leaders (China, Vietnam, Brazil, Russia). China leads everyone by a large margin.
The government is creating a National Critical Mineral Stockpile for rare earths, aiming to ensure a two-month supply in response to China's export curbs.
Gold Accumulation
Indian households have the largest private holdings of gold in the world, with estimates suggesting holdings of 25,000 to 35,000 tonnes.
As of mid-2025, India's gold reserves reached a record high of 880 tonnes, ranking it among the top global central bank holders. This is a significant increase from just over 600 tonnes in 2019.
Hence, this has created a significant "wealth effect" for Indian households. This increase in perceived wealth can boost consumer spending and economic momentum.
In recent years, digital gold transactions have surged in India, attracting investors seeking the security of the metal without the traditional issues of buying and storing physical pieces.
India and AI
India is emerging as a global powerhouse in artificial intelligence, driven by significant government initiatives, major investments from global tech companies, and high rates of AI adoption across its economy. This push is supported by a large, skilled technology workforce and a vibrant startup ecosystem.
AI is projected to help achieve a $1 trillion digital economy by 2028.
Why is the country fund ETF so underperforming?
The underperformance of the India country fund relative to the S&P 500 (SPY) can be attributed to several factors, including recent U.S. tariffs on Indian goods, expensive valuations for Indian stocks, a strong U.S. dollar, and the concentration of returns in U.S. mega-cap technology companies.
However, I see strong long-term growth potential just like I did in Vietnam.
And, for those who know me, I am typically early on these types of calls.
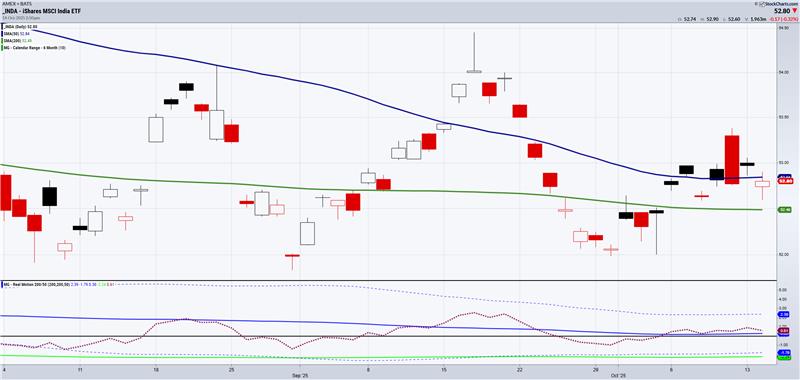
The first chart is a Daily timeframe.
If we look first at the Real Motion or momentum indicator, we see a bullish divergence. This means that the red dots are above the 50-DMA (blue) while the price chart shows the price still under the 50-DMA.
When there is a bullish divergence, we wait for the phase change to confirm before investing.
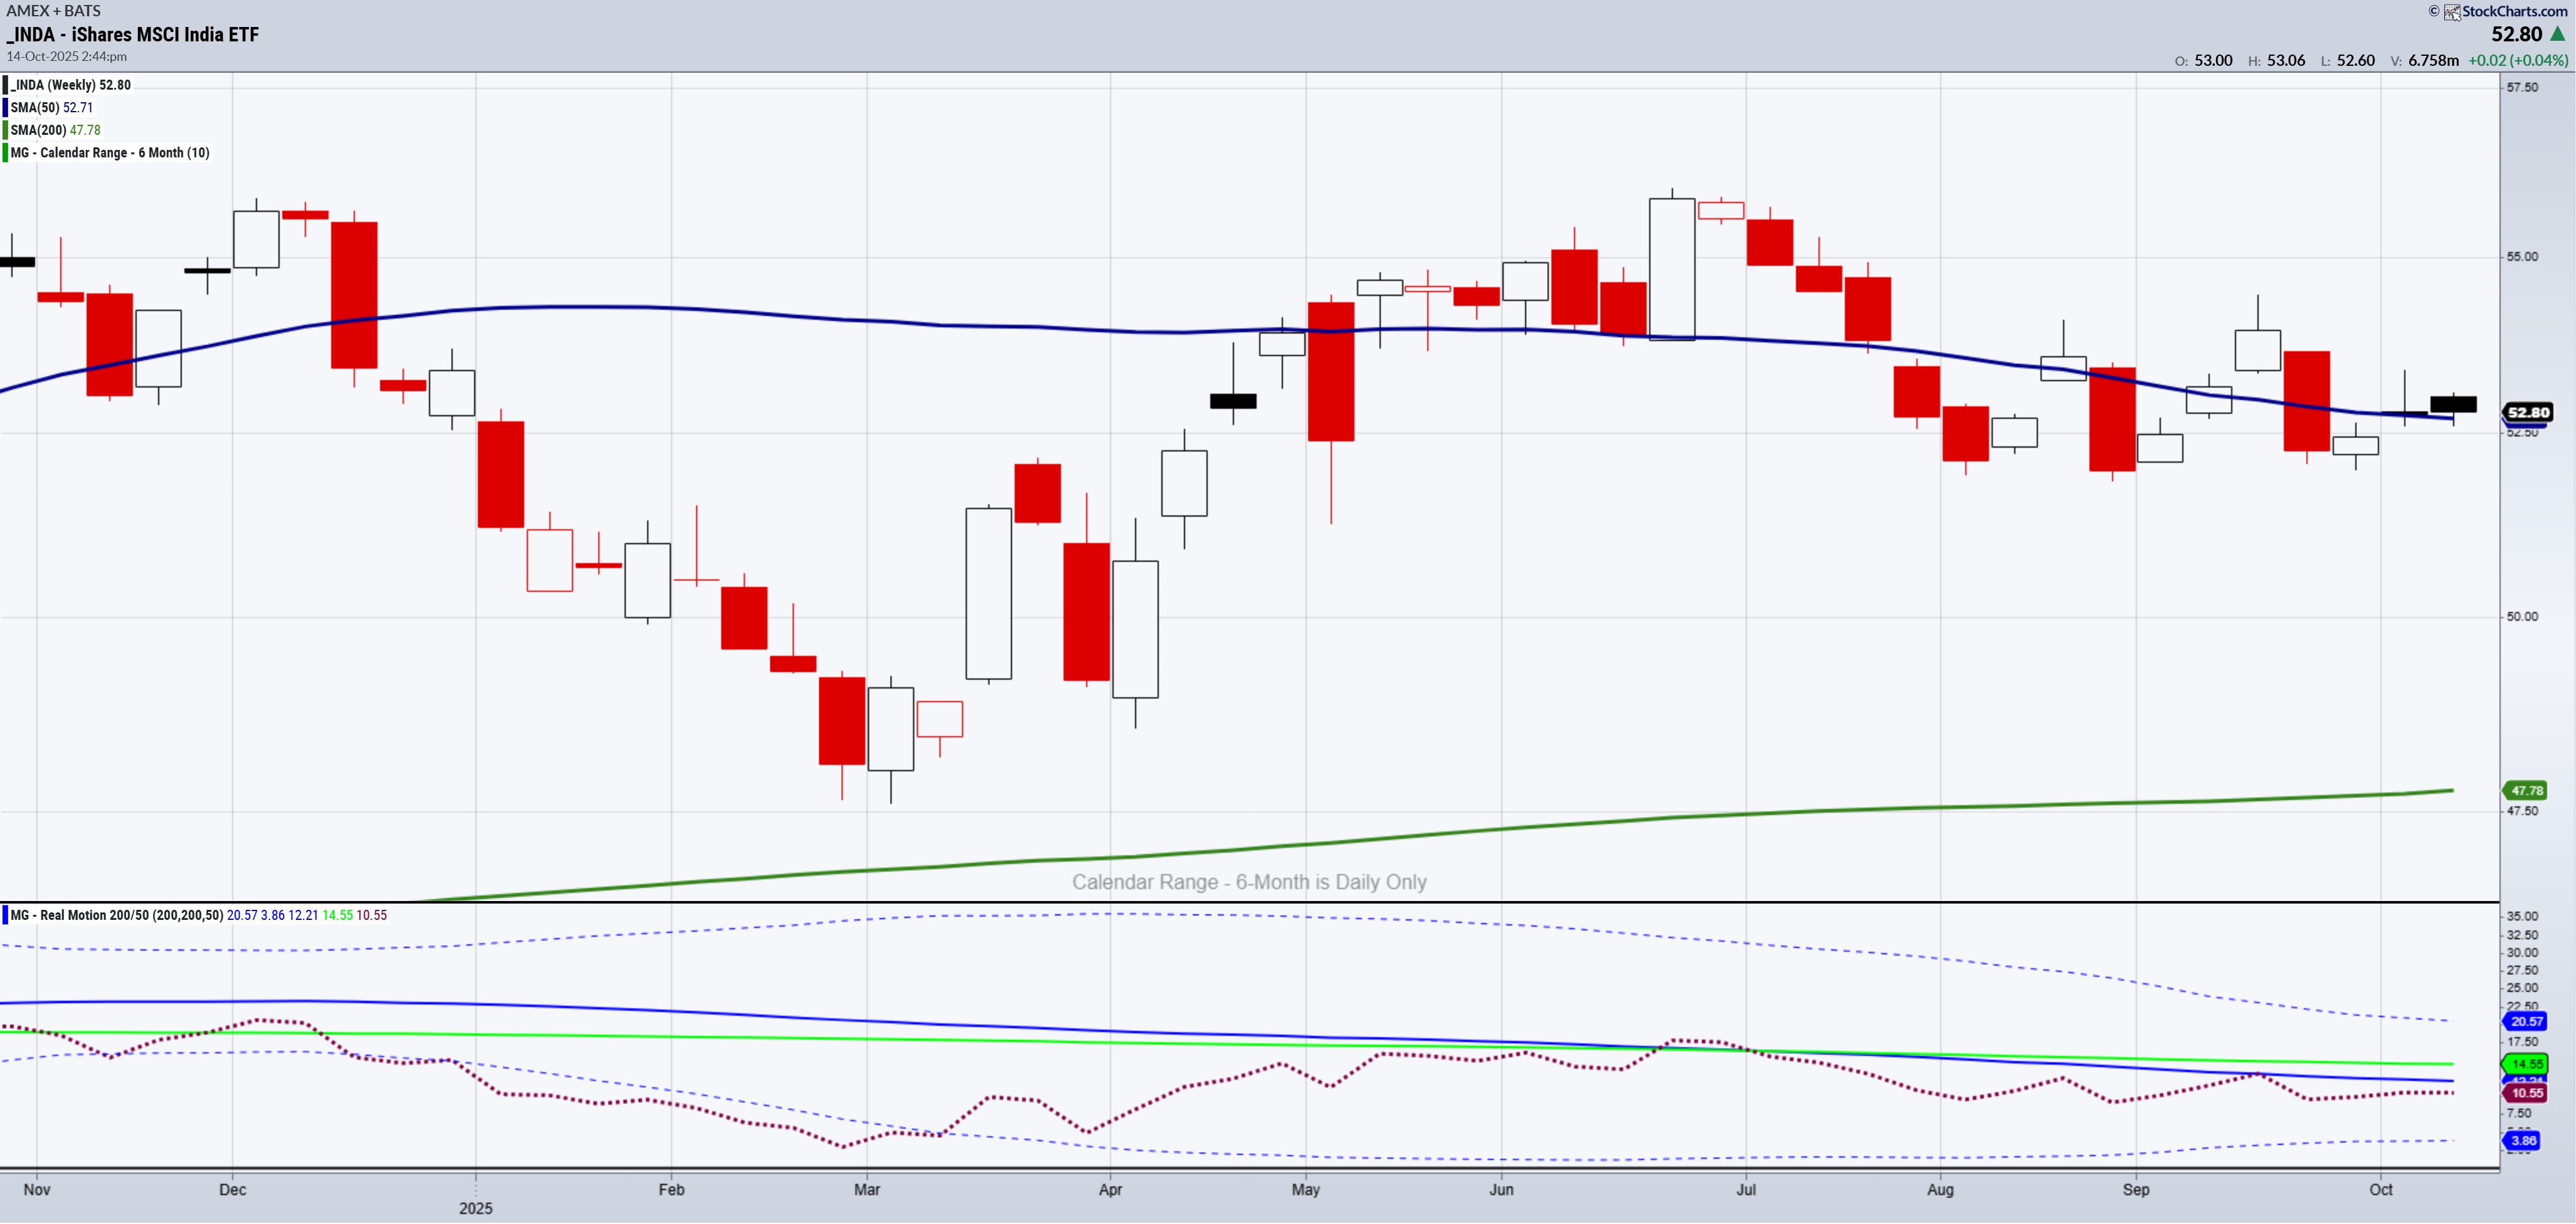
On the weekly chart however, the price is above the 50-WMA which means INDA is in a weekly bullish phase.
Yet another divergence, only this time in timeframe.
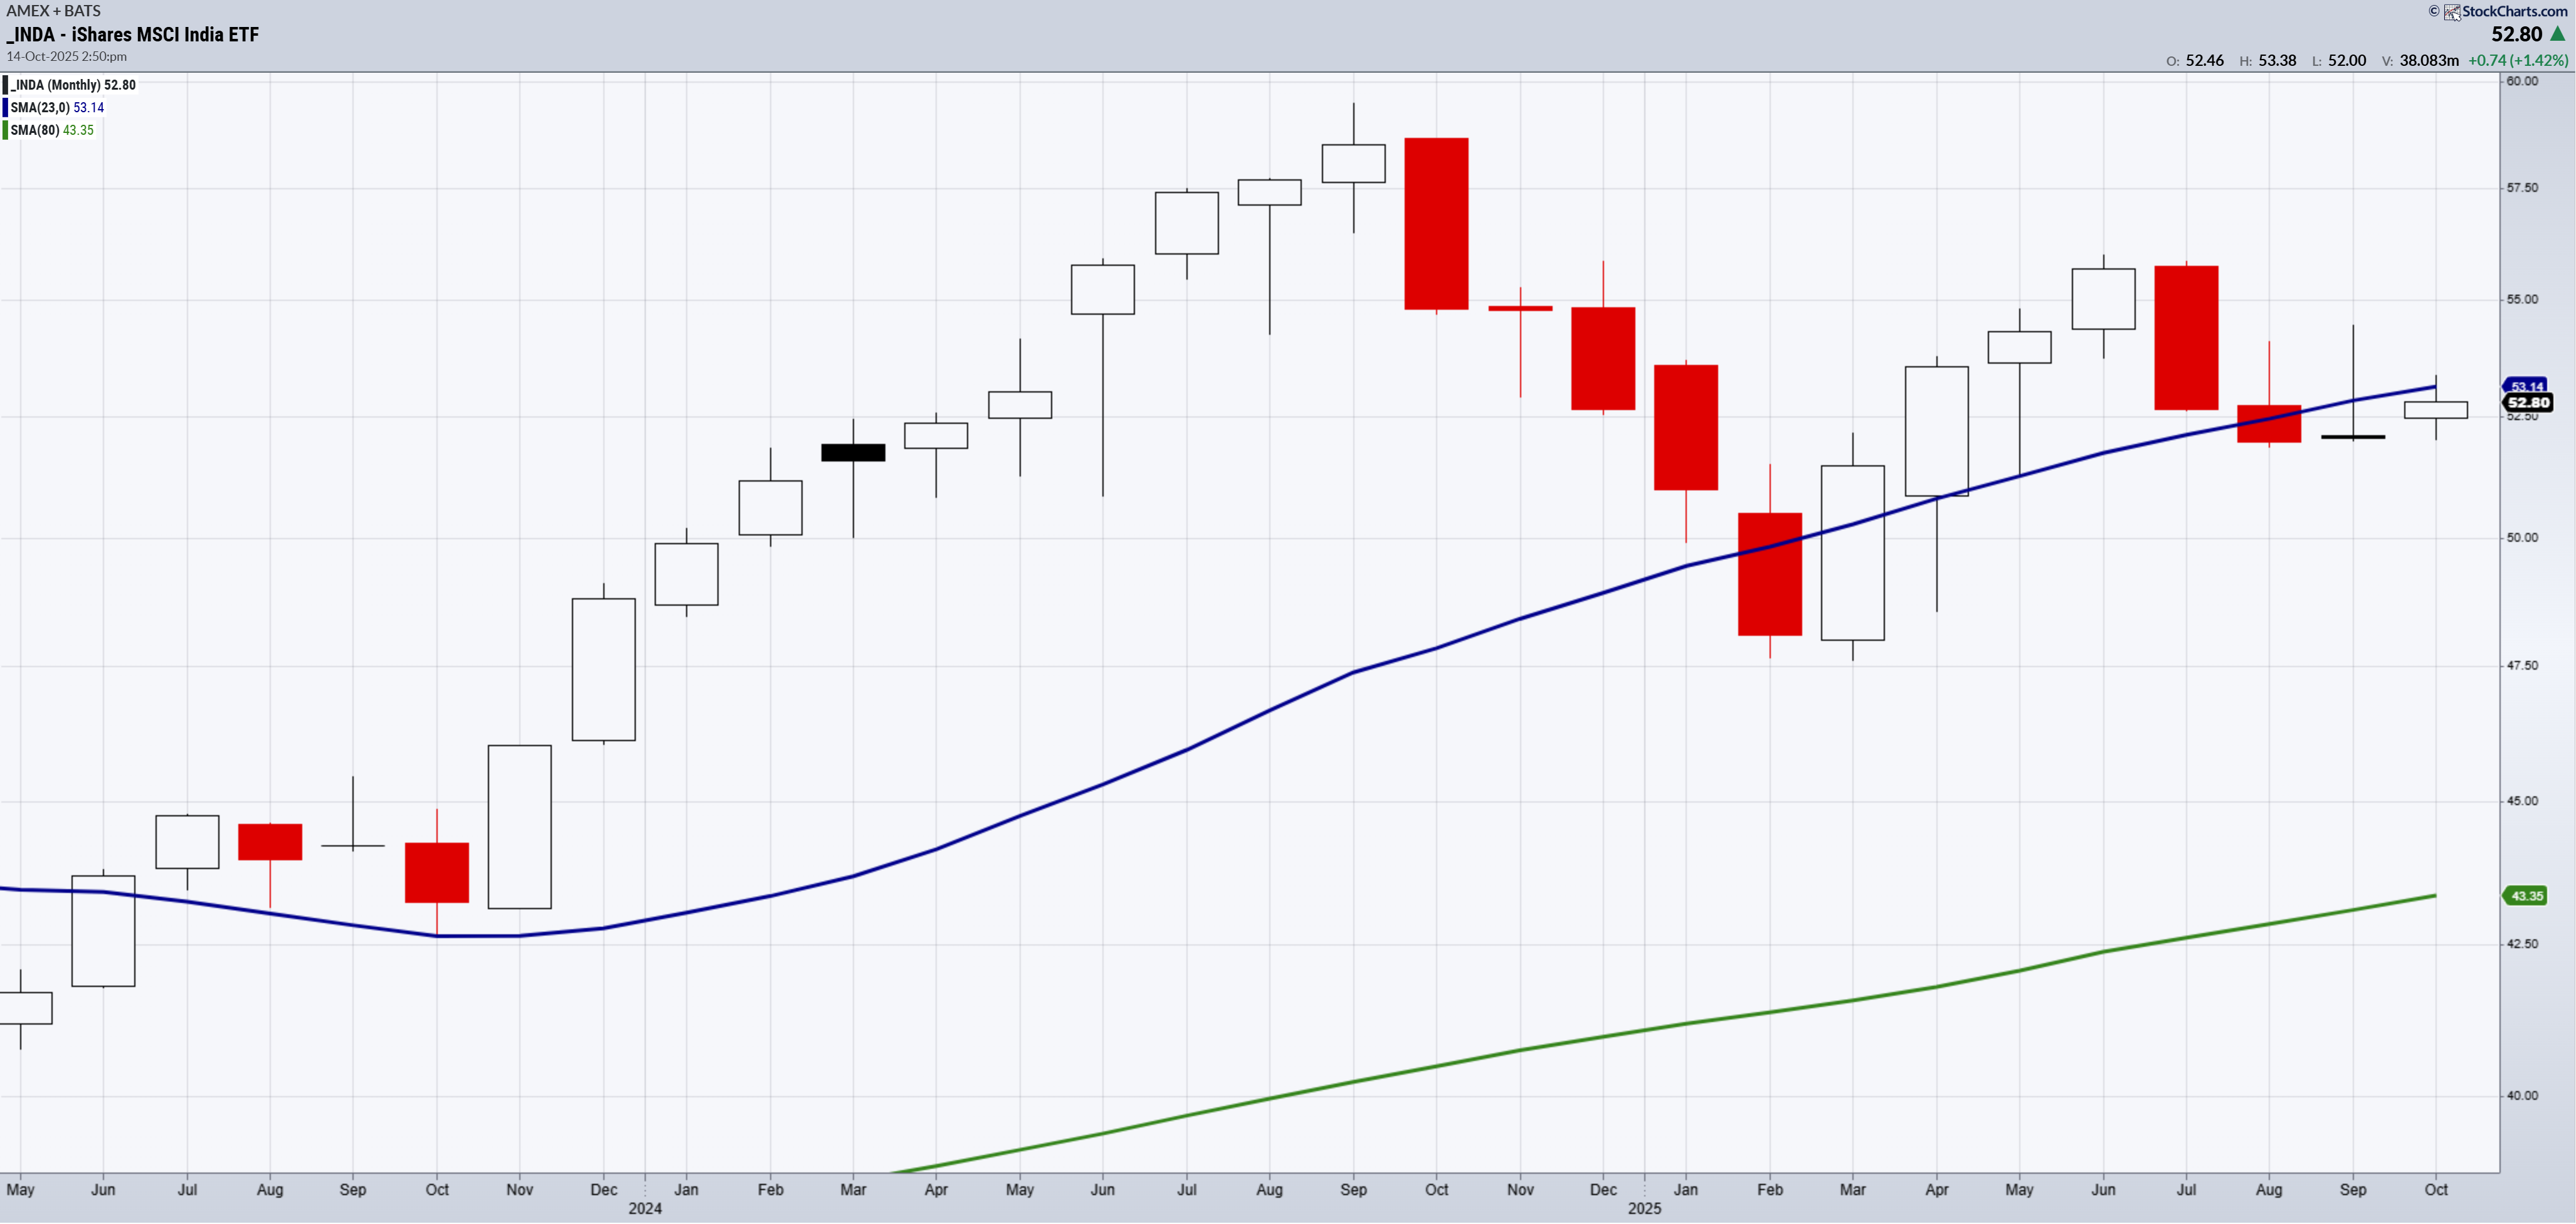
The monthly chart is probably the best for determining a real shift in trend for INDA.
The blue line here is the 23-month moving average. Down below you see the 80-month MA.
I love the 23-month as it accurately measures a 2-year business cycle shift.
Once INDA closes a month over that 2-year cycle, it signals an economic expansion.
INDA has been above it so far in October, while currently it struggles to maintain that level.
Should the Daily chart confirm a phase change to bullish, that will put the monthly chart price over the 23-month moving average.
Then we can say we have a weekly confirmation and positive momentum.
Limited offer.
Real-Time Trading with Mish
Hi,
For some time now, I’ve been sharing my knowledge and mentoring investors on Slice: a platform built for real connections between mentors and investors. On Slice, you can:
To make it easy for you to join, I’m sharing an exclusive offer:
Your first month is only $1 with this promo code: “Mish1”
Join Slice Today. I’d love to connect with you directly and continue growing together as investors.
Warm regards,
Mish,
For more detailed trading information about our blended models, tools, and trader education courses, contact Rob Quinn, our Chief Strategy Consultant, to learn more.
-----Get your copy of
Plant Your Money Tree: A Guide to Growing Your Wealth
Grow Your Wealth Today and Plant Your Money Tree!

"I grew my money tree and so can you!"- Mish Schneider
Mish in the Media-Want to see more? All clips here
FinancialSense Mish talks metals, softs, recession or hyperinflation and current macro themes 10-10-25
Business First AM Mish covers one stock to watch and how to trade cryptocurrencies 10-10-25
Weibo China TV Mish explains that waiting for a dip is the smarter move right now 10-10-25
Business First AM The Trifecta of Inflation Trading Tips 10-03-25
Coming Up:
October 20 LIVE Schwab, Yahoo Finance and Fox Business
October 21 LIVE Yahoo Finance
October 22 LIVE NYSE TV
ETF Summary
(Pivotal means short-term bullish above that level and bearish below)
S&P 500 (SPY) 658 support 667 resistance
Russell 2000 (IWM) New all-time highs-nice
Dow (DIA) 460 support 465 resistance
Nasdaq (QQQ) 585 support
Regional banks (KRE) 63.00 pivotal
Semiconductors (SMH) 340 resistance
Transportation (IYT) 70 huge support Thru 73 interesting
Biotechnology (IBB) 150 support
Retail (XRT) Back to unconfirmed bullish phase-needs a second close over the 50-DMA
Bitcoin (BTCUSD) Has to clear 115,000

Every day you'll be prepared to trade with:


