March 2, 2016
Mish's Daily
By Mish Schneider
Good Things Come to Those Who Wait- Nayobe 1986
“That special moment has arrived
And now I'm sure this love we have is real
And I know that our love will survive, 'cause
Good things come to those who wait….”
Honestly, at this point I cannot remember how long I have been waiting for the bottom in many commodities to happen and confirm.
In January 2014, I caught the spectacular move up in coffee and corn futures. Since then, I have traded a couple of pops here in there in the metals and miners. This year, my very first trade was to buy the Gold ETF, (GLD) at 104.30. We still have a tail of that in the Advantage Service.
There are times when hoping one’s “love will survive” a losing position is very costly indeed. However, the other side of that coin is having a focus and conviction. More importantly, traders need a set of rules to help with trade execution, risk control and trade management.
Commodities have had a few false starts since I began writing about their eventual bottom the end of last year. Nevertheless, what’s past is past.
No time like the present in commodities?
First, a review of my favorite criteria for a bottom.
And my newest Criterion:
Keeping the above in mind, I will illustrate with U.S. Steel (X), which today alone, was up over 24%!
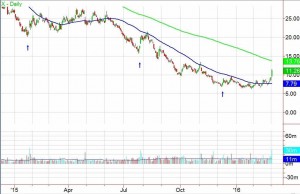
A classic example of a few false starts which were all good signals. The first arrow shows the low in mid-January 2015 with big volume. That yielded a move from 20.00 to 27.68 before petering out. Not surprised it couldn’t sustain forever though. The Phase changed to only a weak Recovery.
Second arrow shows yet another false start. July 2015, a good bottom signal with volume. Issue-no phase change at all. Actually, it ran perfectly to the 50 DMA and stalled.
Third arrow is December 2015. Volume did not come in until the 2nd and 3rd day after it made a new low. It was not only a new low, it was a new, new low as in never before been down there.
Since then, X consolidated until last week when it changed phases to Recovery. Prolonged bear phase? You betcha! Momentum Indicator then-not a new low. Interesting. Note the slope on the 50 DMA-neutralizing. Bottoming? Well yes, but you still need to employ trade management.
As for the rest of the Commodities? Clearly GLD and GDX are even more spectacular looking than X. Yet, I suggest you keep your eyes on ALL commodities from sugar to water to grains.
“Good things come to those who wait, but better things come to those who are patient.”
S&P 500 (SPY) 200-202 next point of resistance and fairly significant too. 195 key support
Russell 2000 (IWM) Confirmed phase change to recovery but more importantly, back over the 200 week moving average if closes there by Friday
Dow (DIA) Confirmed recovery phase. 170-172 big resistance
Nasdaq (QQQ) Confirmed recovery phase. 108 big resistance
XLF (Financials) Unconfirmed phase change to recovery with a 2nd close needed over 21.82. BTW, for a bottom? Island bottom classic example
KRE (Regional Banks) I love Granny, Tranny and Gramps. But we must see Prodigal Son at the party too. 50 DMA at 37.25
SMH (Semiconductors) 52.55 the 200 DMA
IYT (Transportation) 134.23 a big one on the weekly charts-if good, should hold it by the end of this week. Resistance 136.40
IBB (Biotechnology) Still well underperforming with 270 key resistance
XRT (Retail) 44.60 good daily chart resistance. Support 43.20
IYR (Real Estate) Almost a surreal move from the bottom to the present price-straight up! Moment of truth now-73.95 weekly chart point
GLD (Gold Trust) Inside day. Constructive
GDX (Gold Miners) Inside day. Unless it breaks under 18.50 should still be consolidating.
USO (US Oil Fund) A close over 9.35 would be the best close in a month. Continuous contract in an unconfirmed recovery phase
XLE (Energy) “Over 58.50 like it to 61.00 area.” That makes 58.50 new support
XOP (Oil and Gas Exploration) Love here too as it ran to the 50 DMA
UNG (US NatGas Fund) And then there’s this-getting no love!
TAN (Guggenheim Solar Energy) Filled gap-like to buy dip now to 23.40 or so
TLT (iShares 20+ Year Treasuries) 130 pivotal
UUP (Dollar Bull) 25.25 is the area to hold
FXI (China Large Cap Fund) Unconfirmed phase change to recovery

Every day you'll be prepared to trade with:


