December 13, 2015
Mish's Daily
By Mish Schneider
According to the Hemline Theory, if skirts are short, it means the markets are going up. And if skirts are long, it means the markets are heading down.
First noted by Wharton Business School Professor George Taylor in 1926, at a time when hemlines rose with flapper dresses during the so-called Roaring '20s, the Great Depression subsequently set in and hemlines fell to the floor once again.
So if long skirts are worn more in times of fear and general gloom, indicating that things are bearish, I wonder if the Economic Modern Family (especially Granny Retail) noticed the longer hemlines that started to appear in the September Vogue issue?
Alexander Wang (a well-known American fashion designer of Asian descent), designed his Fall line with skirts below the knee. Was he sensing China’s woeful economic forecasts?
Michael Kors, Valentino and Stella McCartney followed in kind in the October Issue. In the November Issue, Victoria Beckham and Gucci jumped on board.
With the December Vogue issue currently on my nightstand, I noticed even Derek Lam (Michelle Obama’s go to designer), featured dresses and skirts calf-length.
What trend will last longer: The Economic Modern Family’s Bearish Phases or Conservative Hemlines?
Naturally, the Hemline Theory has been debunked by most serious analysts. For one, fashion duration has increased in velocity. In fact, the trends in fashion tend to have shorter lifespans than our current economic cycles do.
The Economic Modern Family, though is Omnipresent!
Granddad Russell (IWM) fell into a Bearish phase last Tuesday. I’ve been tracking Gramps’ inevitable decline ever since he failed to hold above the trifecta of resistance.
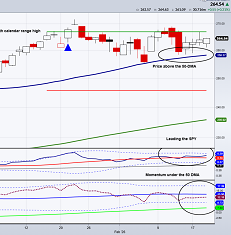
Granny Retail (XRT) has had only 2 brief visits above the 50 DMA since last July. Her Bearishness has kept the brakes on the retail stocks most notably at a time when they should have shone.
Transportation, (IYT) almost gave the market glimmers of hope in November. This month, however, it’s been lower gears on the decline. Big Bro Biotechnology (IBB) finally gave it up now looking like the Mother of all Bear Flags is waving him across the finish line.
Semiconductors (SMH) our Economic Modern Family star, hasn’t put the miniskirts in storage just yet. SMH is holding above the 200 DMA. If there is any strength to be had, here’s where to look.
Regional Banks (KRE), Prodigal Son, let down the hems of many of his skirts (didn’t know our Prodigal was a cross-dresser, huh?) Now in a Distribution Phase, KRE has decent support just below on the 65-week moving average or 41.26.
I could add a couple of midi-hems to my wardrobe but what excites me most is the hot, haute hippie look that’s in for 2016. If I’m dressing the Economic Modern Family up for Nostalgia, might as well embrace the Chloe combination of menswear with dreamy hippie fashion and a practical cape for the ensuing cold winter.
S&P 500 (SPY) Looking at 200-202 as support area. 203.25 resistance until 205
Russell 2000 (IWM) 112 pivotal with 114 now resistance and if breaks 111.53 109 next support
Dow (DIA) 174 resistance with 171.55 support
Nasdaq (QQQ) 108.80 holds the 200 and 100 DMAs-major support should this open weaker. Otherwise, 109.50 November low and 111.55 pivotal area (50 DMA)
Volatility Index (VIX) I should have known this would fly when my mother called me last Wednesday and asked me what Vix is.
XLF (Financials) Why I find Accumulation Phases tricky in 2015. Just didn’t spend enough time in a bearish phase to recover that fast. Now, expect we will stay negative for awhile
KRE (Regional Banks) Watching the longer term charts now 40.67 and 41.26 month and week moving average support
SMH (Semiconductors) What a day to get a Golden Cross. However, the price is sitting on the moving averages. Could be an early holiday gift-major focus here Monday
IYT (Transportation) 134 support and if can get back over 138-relief
IBB (Biotechnology) After the 2 inside days, the break was telling alright. Unconfirmed bearish phase which means looking for a second close under 323.60 and if closes above, maybe another bounce to 330
XRT (Retail) 43.33 some support with the double bottom at 42.00 if indeed it is one.
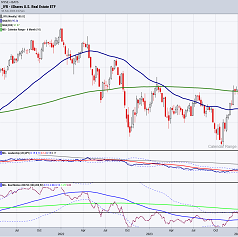
IYR (Real Estate) Still not that bad looking a chart if holds around 72 down below
ITB (US Home Construction) All about holding 26.50 now
GLD (Gold Trust) Over 104 is something
SLV (Silver) Maybe, just maybe a reversal bottom
GDX (Gold Miners) Over 15 much better
USO (US Oil Fund) Oversold on all timeframes. A bounce here will help all
XOP (Oil and Gas Exploration) Holding the one-day reversal bar low at 30.97 so still a shot
TAN (Guggenheim Solar Energy) Oil companies cannot own the sun, but they might figure out that fossil fuel is over and harnessing the sun is the future
TLT (iShares 20+ Year Treasuries) Looks like the Fed has some real dilemmas ahead with this flight to safety and move over all moving averages
UUP (Dollar Bull) Still holding those moving averages by the skin of its teeth
GREK (Greece) Doesn’t really trade well but is holding the reversal pattern
FXI (China Large Cap Fund) 34.32 support and a good place to bounce from

Every day you'll be prepared to trade with: