June 1, 2016
Mish's Daily
By Mish Schneider
Granddad Russell 2000 may not be as close to the October-November 2015 highs as the S&P 500 is. When IWM rallies, it may not look as sexy as NASDAQ does with its Google and Facebook and Amazon.
Nevertheless, when IWM rallies, the broadest index, my Economic Modern Family sure notices. So did the buyers/sellers of the 612,058,623 million shares that traded in May, in addition to the over 26 million shares that traded today.
And you know what’s strange? That’s nothing.
The average monthly volume of shares traded in IWM is over 810 million. In a day, average volume equates to over 28 million. That puts the recent volume only 2/3 of the average. So while millions take note, millions are left sidelined.
Granddad is dancing as fast as he can and he still hasn’t filled the auditorium.
Have any of the other indices met the average volume for the month of May? And if not, what does that mean for this rally continuing or not?
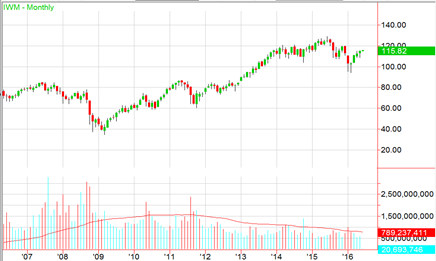
The IWM chart above goes back from 2006 to the present. The dip in 2011 happened after the US government shut down. Since then, all significant corrections have not succeeded in reversing the super long-term trend up.
IWM came close to the edge in January. Therefore, keep a mental note that 94.00 is support ultima! Monthly volume since January has been scant for sure. Yet, except for a better than average volume pop in October 2014, volume has basically suffered for years.
NASDAQ, the Dow and the SPY 500 have had more big volume months than the Russell has had, yet those too see months in a row of anemic volume.
When I say Granddad lacks sex appeal, now that I’ve done this work today, I’m thinking IWM is more a victim of ageism! Or at the very least, highly misunderstood!
Maybe it’s because I’m older than I used to be so older men have more appeal to me. But I gotta say, I’m hot for Grandpa!
Is Grandma Retail feelin it?
Let’s say maybe she’s starting to. XRT is in a Bearish Phase to Granddad’s Bullish one. With Granddad’s swan song can Granny get her groove back?
Guess when XRT’s last month of better than average volume was? October 2011! The same time when the government shut down and IWM fell along with pretty much everything.
Since 2011 and even during the great bull run of 2013 to 2015, poor consumer sentiment and tepid GDP numbers have made headlines. Those headlines have scared away millions of investors.
If this rally is to really last, consumers and/or Granny’s people need to come back. Perhaps consumers are those gremlins the Dow sees whenever it hits 18k! Imagine if those gremlins disappear.
S&P 500 (SPY) Hasn’t changed-April high 210.92. Has to hold 208.50
Russell 2000 (IWM) 115.05 new intraday pivotal number.
Dow (DIA) Managed to defend 177.29 the 50 DMA
Nasdaq (QQQ) 110.60-111 next resistance. Has to hold 108
XLF (Financials) 23.50 near term support to hold
KRE (Regional Banks) 41.91 is the place for this to close above and 40.98 interim support to hold
SMH (Semiconductors) Sister Semis-wish I gave her more attention. She’s killin it! 57.46 a gap to fill with 56.99 intraday pivotal area
IYT (Transportation) Has 2 hurdles. The 50 DMA at 140.60 and the weekly MA at 140.10.
IBB (Biotechnology) If holds 275 could see 290
XRT (Retail) 41.75 is the support to hold.
IYR (Real Estate) 77.50 support and risk point
ITB (US Home Construction) If clears 28.00 should continue
GLD (Gold Trust) Held 115 level which is my bottom line hold point. Would like to see it move over 116.40
SLV (Silver) 14.90 support. Through 15.31 better
GDX (Gold Miners) closed back over the 50 DMA.
USO (US Oil Fund) 11.44 support and through 12.00 impressive
OIH (Oil Services) 28.50 on a weekly close is important to clear
XOP (Oil and Gas Exploration) Like!
UNG (US NatGas Fund) First time over the 100 DMA since last August.
TAN (Guggenheim Solar Energy) 21.70 support
TLT (iShares 20+ Year Treasuries) Unconfirmed bullish phase
UUP (Dollar Bull) 24.50 support. I’m getting a bit negative again
FXI (China Large Cap Fund) confirmed phase change to recovery

Every day you'll be prepared to trade with:


