December 8, 2021
Mish's Daily
By Mish Schneider
Written by Forrest Crist-Ruiz
Over the past three trading days, the major indices have made a remarkable rally from the recent lows.
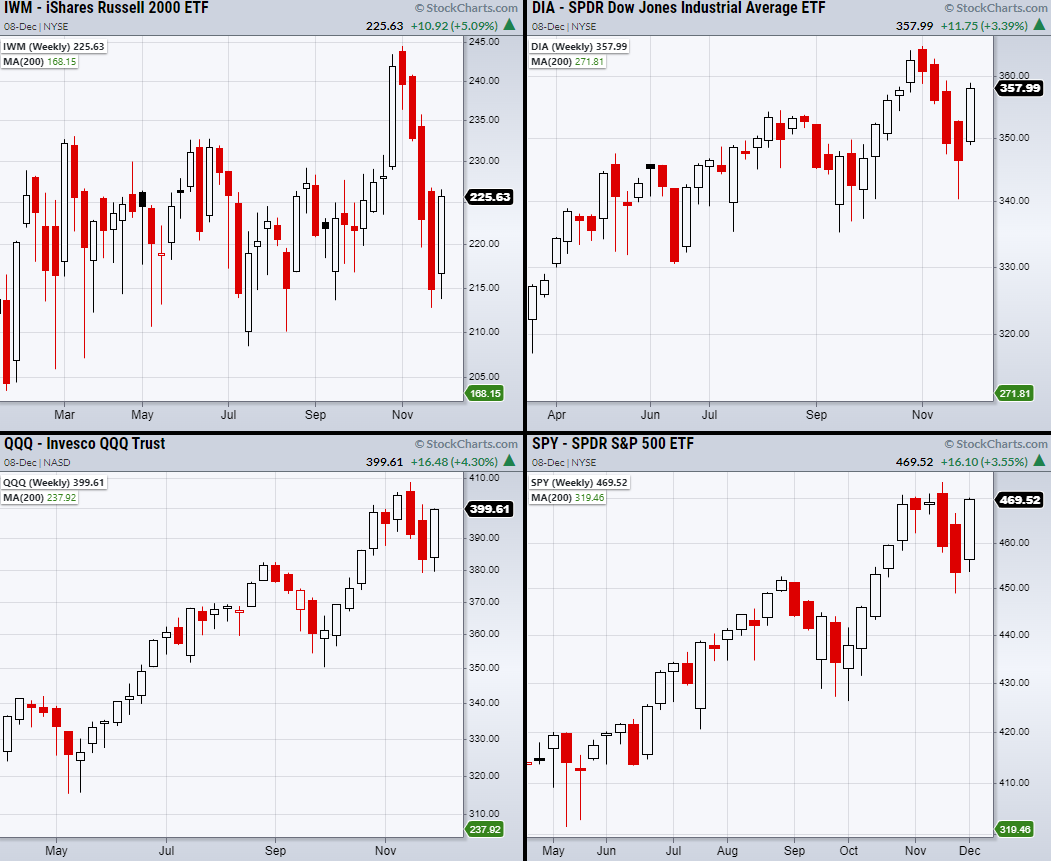
However, the small-cap index Russell 2000 (IWM) has only bounced back into the middle of its trading range.
As seen in the above weekly chart, IWM has spent a large portion of time stuck between $234-208 with a short-lived break to new highs.
Overall, IWM has been lagging the rest of the indices and is now back in the middle of its range with a decent amount of overhead resistance.
With that said, this is not the case for the other indices as the S&P 500 (SPY), Nasdaq 100 (QQQ), and the Dow Jones (DIA) have held upward trends.
However, we should be watchful if other indices start to behave like IWM.
One reason other indices could become rangebound is from stagnant economic growth from rising inflation.
Additionally, without any more stimulus packages and continued bond tapering from the Fed, the market does not have a lot of upside potential to focus on.
While demand is expected to grow, supply chain problems will persist through the next year leading to possible stagnation.
There is also the idea that the Fed could begin to raise interest rates sooner adding overhead pressure to the stock market.
With that said, price action is still king.
Therefore, if the indices are going to prove the stagflation theory wrong through next year, DIA, SPY, and QQQ should clear highs and hold them.
Constant new highs paired with a steady supply of goods is what the market needs to combat stagnant and potential rangebound trading through next year.
++++++++++++++++++++++++++++++++++++++++++++++
Follow Mish on Twitter @marketminute for stock picks and more!
Follow Mish on Instagram (mishschneider) for daily morning videos!
To see updated media clips, click here.

S&P 500 (SPY) 473.54 high to clear.
Russell 2000 (IWM) Watch for the second close over the 200-DMA at 224.37
Dow (DIA) Confirmed a bullish phase with a second close over the 50-DMA at 353.53.
Nasdaq (QQQ) 401.19 to clear.
KRE (Regional Banks) 71.94 to clear.
SMH (Semiconductors) Doji day. 318.82 high to clear.
IYT (Transportation) Doji day. 273.72 resistance area.
IBB (Biotechnology) 153.38 resistance.
XRT (Retail) 95.72 50-DMA to clear.
Junk Bonds (JNK) Flirting with the 50-DMA at 108.39.
SLV (Silver) watching to clear 20.91.
USO (US Oil Fund) 55.78 gap to fill.
TLT (iShares 20+ Year Treasuries) Potential support near 146.70 area.
DBA (Agriculture) 19.86 pivotal level to clear.

Every day you'll be prepared to trade with:


