March 9, 2016
Mish's Daily
By Mish Schneider
“Head in the clouds got no weight on my shoulders.”- Problem by Ariana Grande
In my daily search for clues as to what might come next for the Market, I look in lots of places.
I watch my Economic Modern Family. Analyzing the Russell 2000, Retail, Transportation, Semiconductors, Regional Banks and Biotechnology, I get a picture of whether or not those 6 instruments are working together or are diverging, thereby sending mixed signals.
Currently, everyone in the family except Biotechnology is in a Recovery Phase. Biotechnology or Big Bro, remains in a Bearish Phase. More on that later.
I watch for unusual volume patterns. Not since February 11th when the S&P 500 made an attempt at a new 2016 low, has volume been particularly spectacular or interesting.
I watch Interest Rates or the TLTs. Best we can say there is that the trend for rates to stay low seems intact. However, with the recent price drop in TLTs, it’s possible that could change.
Although there are several other indicators I watch such as Relative Strength, Fundamentals, Sector and Group Rotation, for today’s purposes I return to where my trading life began-good old fashioned chart patterns.
Why is the SPY chart important?
It is designed to track the market capitalizations of 500 large companies. It is considered one of the best representations of the U.S. Stock Market as well as a bellwether for the US Economy.
Bellwether for the US Economy?
If that is the case, if SPY is an indicator or harbinger of what’s to come, what might we say looking at the chart right now?
Head and Shoulders Top
Let’s face it, the market is confusing. We’ve recovered from the January crash yet “Recession” cries still exist. The future of Fed Policy hangs in the balance. Commodities are rallying off of multi-year lows. Nobody knows how the Trump factor or this Presidential election will play out. The world lives on high alert in case of any terrorist attacks.
A Head and shoulders formation occurs when a market trend is in the process of reversal either from a bullish or bearish trend.
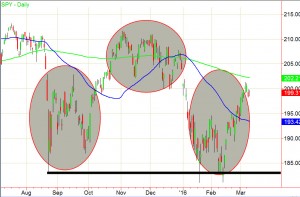
In the chart above, I highlight the possible head and shoulders top in the SPY. A H&S top formation consists of a left shoulder, a head, and a right shoulder and a line drawn as the neckline. The neckline on the chart above is black.
The left shoulder is formed at the end of an extensive move during which volume is noticeably high. The right shoulder is formed when prices move up again but remain below the Head. Volume is lesser in the right shoulder formation compared to the left shoulder and the head formation.
As Head and Shoulders tops go, this one is pretty symmetrical. If the neckline breaks at 181.00, I would strongly consider preparing for a nasty drop. If the price in the SPY rises above the head or around 202-204 level, perhaps the monstrous correction that was publicized as the “end of the world as we know it”, was simply just a plain vanilla correction.
While we try to figure that out, I’m assuming this pattern could very well be the handsomest Head and Shoulders Top I’ve seen. One for the textbooks. Therefore, as you read each day, I continue to stick to mainly Commodities and active trading in equities. Most recently, I added a small defensive position in the SPY to our portfolio.
S&P 500 (SPY) Inside day. A pause which comes as no surprise after recent price action.
Russell 2000 (IWM) Teeny volume and a doji day. Also a pause under the 100 DMA but over the 10 DMA
Dow (DIA) Inside day under the 100 DMA
Nasdaq (QQQ) Inside day with 103.50-104 key support.
XLF (Financials) 21.75 key support
KRE (Regional Banks) 36.90 support
SMH (Semiconductors) Inside day and confirmed Recovery Phase.
IYT (Transportation) Inside day 134.00 level support. 136 number to clear
IBB (Biotechnology) A market without speculators…
XRT (Retail) If breaks under 44.20 we got a reversal in the works with support down at 43.00. Over 45.56 life.
IYR (Real Estate) Not surprising to see an inside day after the nasty candle action. 73.25 the 200 DMA
GLD (Gold Trust) Everything corrects eventually. Even this. Long term bias though, still bullish
SLV (Silver) 14.40 key support
GDX (Gold Miners) Nice comeback after the correction Tuesday.
USO (US Oil Fund) Seems higher prices are in store with resistance at 11.15
UNG (US NatGas Fund) Good action near the lows
TAN (Guggenheim Solar Energy) Terrible volume although inside day.
TLT (iShares 20+ Year Treasuries) 127.50 support and 131 pivotal

Every day you'll be prepared to trade with:


