December 14, 2015
Mish's Daily
By Mish Schneider
This weekend, Keith and I saw the new 007 film, “Spectre.” We both really enjoyed it, but what struck me most was the Octopus as the symbol of Spectre (not to mention the erotic dance between the octopuses and the silhouetted women as the opening credits rolled.)
Earlier this year, (August 5th), I wrote a few pieces on the Octopus, and how one who dreams of an octopus with its tentacles out in all directions could indicate that the dreamer may fall into a lot of trouble.
It was shortly thereafter (August 24th), the market had its dramatic decline.
In the film, clearly James Bond was bound to fall into a lot of trouble considering Spectre means “threat” and “menace.” The Octopus as the evil organization’s logo implies Bond will encounter a “visible disembodied spirit.” All I will say about that in case you haven’t seen the movie.
Since the Octopus has come up for me again, I delved further into the symbolism and how it relates to the market, particularly as most indices and sectors are either in Bearish phases or close to them.
Although it may seem obvious the market will fall further, the Octopus is a master of disguise. Once the invertebrate releases its thick, black ink in the waters as a method of escape, dark clouds left in her wake leave the attackers lost and confused.
Unless, from the depths of darkness, we know where to look for the light.
Looking at NASDAQ, Monday’s action suggests that, at the least, the big gun stocks are not completely out of ammunition. That does not discount the troubles of our Economic Modern Family however.
I’m using NASDAQs move to help me see beyond the murkiness the Octopus’ ink left behind. Rather than become fooled by the Octopus’ detached limb as the end of it all, I am looking at what loose, excess baggage has been cut and what should be avoided versus which instruments might regenerate nicely.
In the Economic Modern Family, Grandpa Russell (IWM) would only offer us a viable reason to reenter long if Monday’s low proves to be a close enough test of the August lows. I would have to see a strong (volume) move back over 112.
Concerning the other members, the most compelling one to watch is Regional Banks (KRE.) Posting a new 60 plus day low early on, and considering this is the week we should find out the Fed’s next move on interest rates, KRE sets up for a potential reversal near the major moving averages.
After this weekend’s successful Climate Summit, a rare and welcomed unity emerged among 196 nations. If this is indeed a watershed moment for the planet, the ramifications can be far reaching, just like the tentacles of the Octopus.
I have written extensively on solar energy. Monday, TAN, the Solar ETF rallied over 6%. Perhaps that’s where more opportunity begins from.
So, as we near the holidays, instead of seeing an Octopus as giant, grasping and controlling creature operating under an opaque screen, let’s look at it as a creature of adaptation, grace and mental agility.
S&P 500 (SPY) Looking at 200 as support area. 203.25 resistance until 205
Russell 2000 (IWM) 112 pivotal with 114 now resistance and 109 next support
Dow (DIA) Held 171.55 support perfectly and now 174 resistance to clear-not bad looking chart
Nasdaq (QQQ) 108.80 held very well and it closed just under the 50 DMA. A move over 111.55 should take it to 113.50 next. Under and 106.50 next support level
Volatility Index (VIX) Just like that-fear abates with a reversal candle after the new 60 plus day high
XLF (Financials) Holding the month moving average, now needs to look more like a reversal after the Monday new 60+ day low
KRE (Regional Banks) On both the weekly and monthly moving averages, this will look better over 42.00. Needs to hold 40.75
SMH (Semiconductors) Golden Cross trading below the moving averages. 52.20 max support and back over 54.10 not too shabby
IYT (Transportation) Tested August lows and held. Another one that needs to give us a viable reversal pattern to get happy
IBB (Biotechnology) 324 resistance and like that it tested but held the November lows. 310 next major support if fails
XRT (Retail) 43.00 support with the double bottom at 42.00 if indeed it is one. Over 44.20 area better
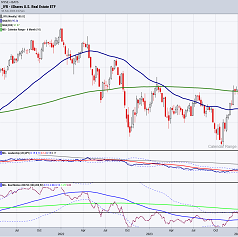
IYR (Real Estate) Still not that bad looking a chart if holds around 72 down below
ITB (US Home Construction) All about holding 26.50 now
GLD (Gold Trust) Still working off the reversal candle from early December not that it gives me much security
USO (US Oil Fund) Obvious it had to rally as it was so oversold. However, not where I would put my money.
OIH (Oil Services) This looks better than USO with a potential triple bottom
XLE (Energy) A good reversal pattern if holds the lows and with good volume possible triple bottom here
TAN (Guggenheim Solar Energy) YAY-Cannot say I haven’t talked about this enough-long and happy!
TLT (iShares 20+ Year Treasuries) Acted like the Fed will hike. We have been here before however
UUP (Dollar Bull) Still holding those moving averages by the skin of its teeth. 25.25 great risk
EEM (Emerging Markets) Possible bottom with volume as well
FXI (China Large Cap Fund) Think this could have bottomed as well

Every day you'll be prepared to trade with: