May 8, 2016
Mish's Daily
By Mish Schneider
There were two key points to spotting today’s reversal.
Today's commentary was written by Geoff Bysshe, co-founder of MarketGauge.
No surprises, and a big sigh of relief. That’s what the end of Friday felt like.
It’s a good thing the jobs data came out before the market opened, because the initial reaction was to push an already lower market lower.
But at 9:30, when the regular session opened nerves had calmed, and traders were more eager to buy then sell, and that set a new tone.
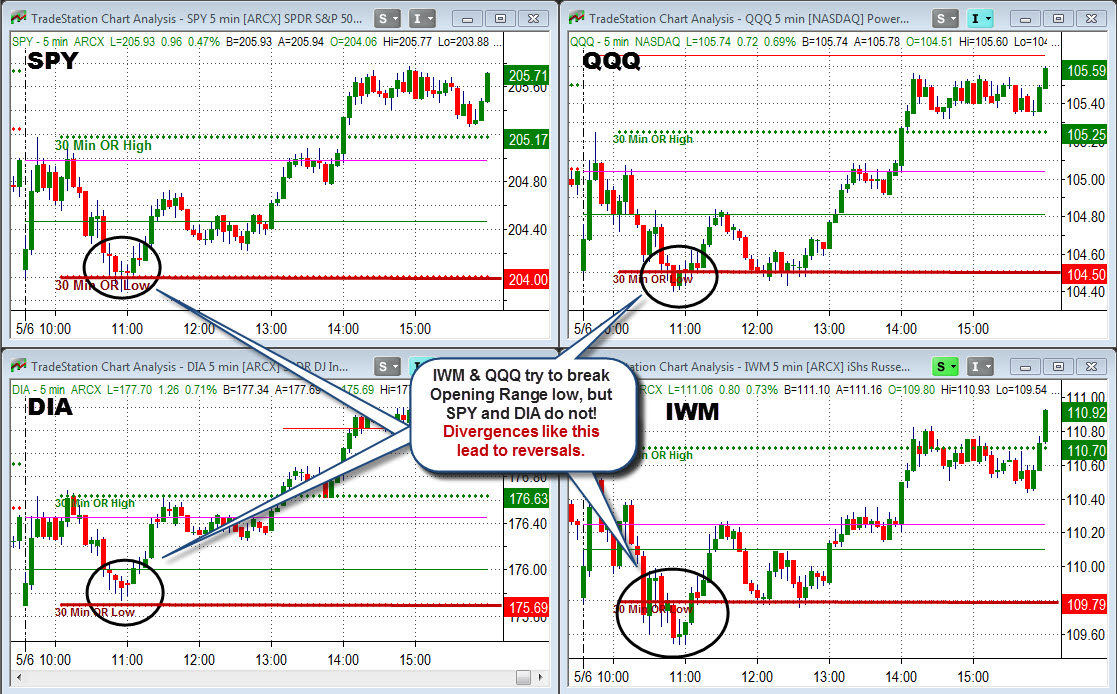
If you were watching the opening range as we’re so fond of encouraging you to do, then you would have noticed a classic reversal pattern at the lows of the day around 11:00 (ET).
Once all four indexes (DIA, SPY, IWM and QQQ) realized they didn’t want to go down, the relief rally began. While the rally wasn’t a spiteful bull comeback, it was enough for traders to start the weekend with a little less anxiety.
There were two key points to spotting today’s reversal.
The first signal was the flush when the news came out in pre-market. A down market dropped immediately with the news. This was not a major market capitulation, but it was enough to flush weak holders, and its subsequent bounce into the open of the regular session, suggested it was a flush.
Second, the initial market opening rally that lasted all of 15 minutes, retraced over the following hour to ultimately test the opening lows at around 11:00 (ET).
The classic reversal pattern that we teach in our Opening Range classes (of which there was a free one Thursday night – get the replay this weekend only here) is a divergence at the 30-minute Opening Range low between the 4 major indexes.
Below you’ll find a chart of it, and if you’d like more details on how and why it works so well check out the free replay link above.
As for next week. Relief rallies don’t create bottoms by themselves. The bulls need to come back on Monday strong, or this market may still be in trouble.
S&P 500 (SPY) Nice bounce off the 204 support area and 50 DMA. The next big numbers to clear on the upside are 206 then 207.
Russell 2000 (IWM) Nice bounce off the 50 DMA at 109.40. The big number to break on the upside it 112. Needs to hold today’s low.
Dow (DIA) Key reversal at the 50 DMA. Not a big move over prior day’s high, however, so needs to clear 118 to confirm a move up. Needs to hold today’s low.
Nasdaq (QQQ) Nice reversal after opening under 5 days of consolidation. Key numbers to clear on the upside are 105.70 and 106.90. Needs to hold today’s low.
XLF (Financials) Held up with the market, but needs to get back over 23.30 to demonstrate any hope of strength. Next big support is 22.75.
KRE (Regional Banks) Bounced with the market on the 50-DMA. Interesting over 39.40.
SMH (Semiconductors) Held up but weaker than the market. Still at 52 which is pivotal and the 200 DMA. There isn’t any good support until 50.25! Needs to clear 53 before considering a long.
IYT (Transportation) Created an interesting double bottom at 136.50, and made up for much of Thursday’s losses. Stopped at key resistance at 139. This is one to watch for trades in either direction it breaks.
XRT (Retail) One of the weaker areas of the market today. The next big level of support is 42 then 41.50.
IYR (Real Estate) Nice breakout continues (even without the TLT’s help)
GLD (Gold Trust) Flag broke to the upside nicely.
SLV (Silver) Inside day on the 10 DMA. Range to watch is 16.75 to 16.40. Next big support should be a 16.
GDX (Gold Miners) Flag and inside day broke to the upside nicely.
USO (US Oil Fund) Consolidating at the 10 DMA. Today and Thursday’s low, 10.80, is a key support level, then 10 should be good support. Needs to get back over 11.05, to consider longs.
XOP (Oil and Gas Exploration) More consolidation on the 200 DMA and other support. A move over 34.60 could start a new leg up. Watch the 10 DMA for resistance, 35.05.
TAN (Guggenheim Solar Energy) Closed unchanged but the first green candle in 7 days! On a big support area – 22.
TLT (iShares 20+ Year Treasuries) Inside day after a big breakout over the 50 DMA. Watch for a big move either way next week.
UUP (Dollar Bull) Quiet day. Now into big resistance from 24.25-.40. There is more resistance over 24.40, but if it can break 24.40 it may have put in a significant low on Wednesday.

Every day you'll be prepared to trade with:


