October 24, 2017
Mish's Daily
By Mish Schneider
 A while back I wrote a piece on Big Brother Biotechnology (IBB). You will get to meet him next week on Facebook Live!
On July 31st, Will Big Pharma Sedate the Market Rally? reminded you that leading medical research requires speculative funds, and if speculative funds are coming into the market, that helps round out the Family.
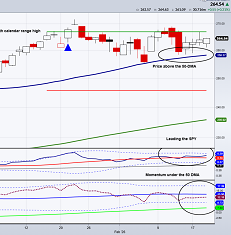
IBB serves as a lead indicator of how much speculative money is flowing into the overall market.
The more optimistic investors feel in general, the more they are willing to speculate in Biotechnology.
The more they speculate, the better the outcome.
If Big Brother is happy, that happiness becomes contagious. We typically see that spread to the rest of the Economic Modern Family.
Will the Russell 2000 (IWM) let us know how specs feel about the future of the US Economy?
He will. And IWM will confer with IBB to help point him in the right direction.
Therefore, this nagging sideways action in IWM while the Dow continues to climb to new highs is noteworthy.
On the weekly chart (below), the channel represented in thick black lines shows that today’s action has the potential for a lot more weakness to come.
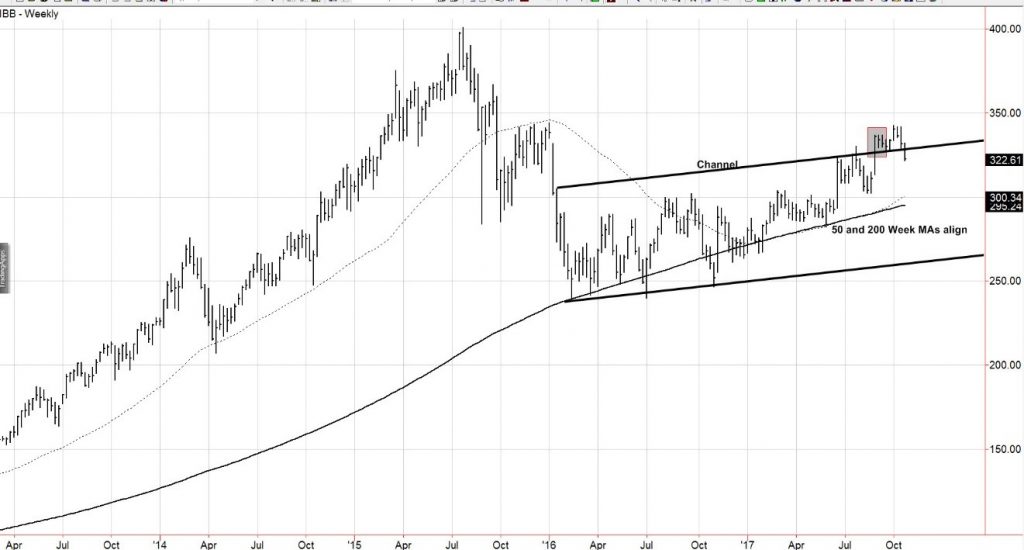
However, with the 327 area pivotal, that claim is premature.
Should this week end below 327, I imagine we also see IWM close out the week testing the key 147 level.
Should IBB hold 327, we can look forward to the status quo and Gramps testing 150 and beyond.
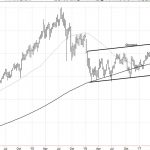
IWM has a monthly channel it cleared over 145. Since the slope of the top of that channel ascends, for the price to sustain above the channel, it must close out his month (next Tuesday) over 147.
I am a big fan of these monthly and weekly channels.
In fact, in a high and wide channel - if the price breaks out from either the up or downside of the parallel lines and then proceeds to trade back into the channel - a trap is often set for the bulls or the bears.
In the case of a bullish channel, if IBB breaks below the high of the channel line and trades back above it, that would be considered extremely bullish.
The inverse is also true--should IBB simply fail the channel, expect follow-through.
Furthermore, the wider the channel, the less velocity the break up or down is. Tight and narrow channels generally have more follow through. The more the energy is consolidated, the more forceful the breakout or breakdown is.
The best part? No need to worry about politics-just follow the charts!
S&P 500 (SPY) Inside day today. 255.50 support for now
Russell 2000 (IWM) 148 some support. The 147 with a close over 150 positive
Dow (DIA) After 2 runaway gaps last week, and yesterday’s reversal pattern, we need not confirm that. Instead, we got a new runaway gap
Nasdaq (QQQ) 149 still pivotal resistance and now we will see what it does at 147 then 145.
KRE (Regional Banks) 56.55 big support.
SMH (Semiconductors) 97.75 near-term support. 100 psychological resistance
IYT (Transportation) 178.65 now pivotal support
IBB (Biotechnology) It’s all about 327 pivotal number and/or a return over 340
XRT (Retail) Granny still trying and that’s a positive
XLU (Utilities) With all the heat, still looks good
GLD (Gold Trust) Inside day-no surprise
SLV (Silver) 16 trying hard to hold
GDX (Gold Miners) 23.00 pivotal as this falls out of favor but continues to hold longer-term moving averages
XME (S&P Metals and Mining) Best close since February.
USO (US Oil Fund) Closed over 10.45 better. Needs follow through
TAN (Solar Energy) Like to see this hold at 22.50
TLT (iShares 20+ Year Treasuries) 123-126.09 range
UUP (Dollar Bull) 24.30 support

Every day you'll be prepared to trade with: