May 17, 2011
Mish's Daily
By Mish Schneider
Just when one might think perhaps it's time to become bearish, the signals are still mixed. IWM clearly the weakest lately, closed with a distribution day in volume yes, closed with a confirmed warning phase yes, but, the slope on the 50 day moving average is up! Plus, it held 81.45 the last swing low made April 14. QQQ closed up on the day and maintained a bullish phase, but could not put in an accumulation day in volume. The slope of the 50 day moving average is neutral.
SPY is what I will focus on tomorrow. Although it closed with its sixth day of distribution in volume, it held not only the 50 day moving average, but also the 70 day exponential moving average. If today was indeed the low, that would mean that looking at the last 3 lows from March, April, and today, we could have three higher lows.
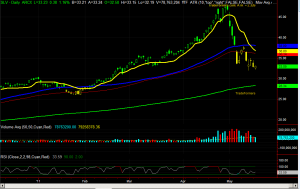
 Other ETF's: another main focus for me tomorrow is SLV. It held S1 and the previous day low. It held the 160 day exponential moving average. The 50 day moving average which is overhead is pointing up. This is still in a warning phase so if you're buying it for a swing you're buying it against a major moving average in anticipation that it can cross over the 50 day moving average and go back to a bullish phase. Otherwise, if you're just looking for a move up to the 50 day moving average which comes in around 38, you are looking at this more for a mini swing trade.
It is also important to watch the dollar. FXE closed with a bullish engulfing pattern after crossing beneath then closing above the 70 day exponential moving average at 141.16. It too has overhead resistance at the 50 day moving average but with a positive slope. If it crosses above 142.50, I would anticipate the dollar to drop further. Keep in mind that tomorrow at 2 PM Eastern standard Time, the Fed will be releasing its minutes. Of course that can also create some havoc.
FXI had a bullish engulfing pattern today although it's still trading beneath all of the moving averages and with a slightly negative slope on the 50. But, if we look at this simply for a phase change the first hurdle for it to cross is a close above 43.55 the 200 day moving average. That would at least put it back into a warning phase with the possibility of it moving up to the 50 day moving average overhead at 44.37.
The ultra-shorts:
TWM confirmed a recovery phase crossing the 50 day moving average for two days yet stopping just below the 70 day exponential at 44.37. 43.03 which corresponds with today's low is now the support area to hold. If it breaks down under there that would be a good sign for the market. 44.07 today's high is the number we have to get through with a confirmation especially on a closing basis over 44.37 which would certainly mean more selling at least in the mid-caps.
SDS closed just shy of its 50 day moving average at 20.99. Above that number I will look to be a buyer which of course also means weakness continuing in the S&P 500.
QID looks very similar in that it stopped just beneath the 50 day moving average at 51.34 another area to watch for. Typically, the ultra-shorts are not the leaders. For that you must watch the indexes.

Every day you'll be prepared to trade with: