December 4, 2011
Mish's Daily
By Mish Schneider
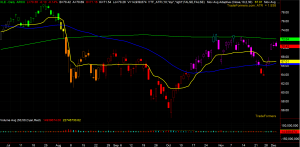
What truly amazes me is where the S & P 500 (SPY) ended. After the 10th biggest winning week since 1950, you'd think there would be some clarity. But NO! S &P had to close with a crap shoot chart. Roll green and it clears the 200 DMA. Roll red and this was a great run to major overhead resistance into the top of a 2 month range high.
SPY: Still working off of an island bottom but failed to cross the weekly moving and the 200 daily moving averages. Has cleared the monthly. Technically, SPY closed down on the day with a distribution day in volume. Let's just say, short term momentum traders hunt, strike and eat their spoils after a day or two at most. That's as far out as one can go right now.
QQQ: The 200 DMA held and this chart looks better than the others, but also stopped at the September 20th high (the fateful day before Operation Twist dump). Will look for decisive action really soon-either good volume, up day and clearing the 200 DMA once and for all, or a trip back to 55.00 and we'll see.
IWM: To my eyes, it's all about the midcaps which remain a concern because although there is an island bottom, the volume patterns are unimpressive and it is still fairly far away from the 200 DMA.
ETFs:
GLD has not had decent volume since November 21st when it was down alot. The 50 DMA has neutralized in slope. Over 170.60 with some volume good looks good and under 168.60 not so much.
SLV (Silver) Got a distribution day in volume and bearish engulfing pattern.
XRT (Retail) Top of the recent range but overbought on daily RSI, not weekly or monthly.
SMH (Semiconductors) A mirror image of SPY. 30.75 to clear, then the 200 DMA. 29.50 has to hold.
XLF (Financials) 12.80 pivotal. 12.60 support. 13.48 Resistance.
 XLE (Energy) Getting the sideways action off the 200 DMA like I asked for. Was the sector/group I began last week watching and makes sense to be the first one to watch again on Monday.
IBB (Biotechnology) The only group to make new swing highs last week after the late July rally. Even though Friday kept it above the all of the work since then, a correction to 99.50 support is not out of the question. Then we will see what this leading group is made out of.
For more detailed analysis join me, along with hundreds of other subscribers, at Mish's Market Minute and get my daily trade picks, trade alerts, training videos, and exclusive analysis tools. Sign up for Mish's Market Minute now and get a free 2 week trial!

Every day you'll be prepared to trade with: