June 27, 2011
Mish's Daily
By Mish Schneider
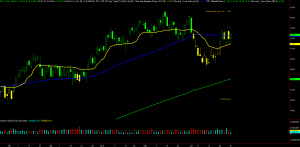
SPY closed up .9% and rallied a little bit more immediately after the market closed based on good earnings at Nike. But, volume was extremely light and I anticipate it will stay that way ahead of the holiday weekend. Looking strictly at price action, it closed above the 10 day moving average yet not above the exponential moving average or Friday's hi at 128.37. It did however hold and respect the 200 day moving average. The slope on the 50 day moving average continues to decline.
QQQ closed up 1.6% above the 200 day moving average on very light volume and beneath the exponential moving average at last week's high.
IWM appears in a new consolidation pattern at higher levels. Will continue to look at this index for a lead which means it must get above 81.11 last week's high and then I would anticipate a move up to the 50 day moving average.
Although we are not likely to see any huge volume coming into the market this week, I would like to see the slope on the 50 day moving averages in all of the indexes at least neutralize before I get extremely excited about this rally. At this point, we have held critical support and are heading into extremely significant resistance with warning phases intact and continuing to accelerate.
ETF's:
SMH consolidating around the 200 day moving average, closing basically right on it. Will look at 32.85 as pivotal and a move above 33.50 very positive.
IBB did what it needed to do and closed above the exponential moving average and key pivots; now needs to clear last week's high 104.29 to keep on going. Overhead resistance at the 50 day moving average 106.02. Otherwise, major support now 103.
 XRT** held 10 day moving average and remains in consolidation with a move over last week's hi 52.87 a good indication of not only a move higher but possibly onto new highs should the markets stay firm and earnings positive. Otherwise, must hold 51.30
IYR did not follow the rest of the market %age wise, has to clear 59.50 and has resistance all the way up with a gap to fill to 60.38. Beneath 58, see this as a sign of weakness.
XLE underperformed and remains above the 200 with a continuing decline in the 50 day moving average overhead.
XLF continues to be range bound. 14.62 support and 15.20 resistance.
SLV covered our puts today booking over $3.00
GLD oversold. Now in a confirmed warning phase. Slope on the 50 day remains positive. Now needs to clear 146.36 for a possible rally back up to 148.
FXI took a long position anticipating a move up to fill the gap to 43.06.
See no reason to change the strategy of buying biotechnology and retail on strength and selling energy, financials, semiconductors and possibly real estate on weakness.
For more detailed analysis join me, along with hundreds of other subscribers, at Mish's Market Minute and get my daily trade picks, trade alerts, training videos, and exclusive analysis tools. Sign up for Mish's Market Minute now and get a free 2 week trial!

Every day you'll be prepared to trade with: