June 15, 2011
Mish's Daily
By Mish Schneider
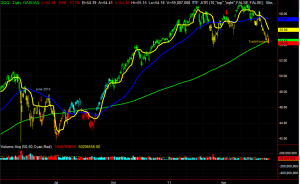
The last time we saw an orange paint bar denoting a distribution phase or one in which the price trades beneath a stacked 50 and 200 day moving average, was right before Labor Day weekend 2010. And if we go back to exactly a year ago, a couple of similarities in the QQQ chart. Up until May 2010, we had been in a bullish phase; then entered a warning phase; then the warning phase started to accelerate as we headed into July; we entered the distribution phase; even saw a death cross towards the end of July which never got much follow through until finally, the price went back through the 200 day moving average and back to a Golden cross in late September, which brings us to today.
 One possible scenario is that we test the recent low of March 16 at 53.77 in QQQ and then get back above the 200 day moving average now at 54.58. Possible. Another is that we drop to test the 50 weekly moving average now at 53.14. Regardless, although we are extremely oversold once again on a weekly chart but not on a daily, it does seem inevitable that we need to go to lower levels before any possibility of consolidation or a volume spike low is put into place.
IWM because did not take out Friday's low today, but does remain above the 200 day moving average. On the weekly chart there is support right below the 200 day moving average should it break Friday's low and the 200. Back in September 2008, the peak high made before the huge selloff was at 77.82. Today we closed above that. Considering how badly beaten up a lot of the bigger stocks are, it would not surprise me one bit to see the mid-caps hold up better and possibly give us the first indications of whether or not we are approaching major support levels.
SPY will most likely test and break the 200 day moving average. But, similar to QQQ, the March low which may wind up being an important level of support is slightly lower at 125.28. Another reason why that March low is significant, is because that same week is when the 50 weekly moving average crossed above the 200. And, the weekly chart in SPY is oversold.
To clarify, the oversold condition is shorter-term, the key support levels and moving averages represent a longer-term picture. The best prediction is for lower prices possibly met with historical support, followed by another bounce. But, until we see strong volume patterns on the upside with neutralizing slopes on the daily moving averages, especially the fast and the 50, these bounces look more like sell opportunities.
As anticipated with the strengthening of the US dollar today, the energy and oil sector got hit hardest. XLE is hanging onto the exponential moving average and OIH has broken the exponential and now looking like it will test the 200 day moving average. I would not be shorting either of these at this point since looking at the weekly chart OIH has tremendous support around 133 and XLE has a bit more room to the downside, but starts coming into major support around 65.
Another key to the market is XLF. What is so interesting is that during the entire bullish run in the fall of 2010, this ETF never even got close to the 200 weekly moving average. Furthermore, the slope of that moving average has been declining since 2008. The conclusion from that is that the health of the financial system has a long way to go before recovery. On the daily chart, we held Friday's low at 14.62 today. Now, if we do not fail that level and start to turn around, the next time we trade above 15.00, that would be another reliable indication that we could see a bounce in all areas.
SLV held up remarkably well today. It's possible that it's finding a base down around the 32 level. And it is equally possible that with the declining slope in the 50 day moving average which is overhead, it is consolidating before breaking beneath 32 and heading for another leg down. Aside in this for now.
Coming in today, the safe money was not on the long side as mentioned in last night's watch, but rather on the short side. Now, the safe money for tomorrow appears to be either in cash, if not already short and the market drops further, or watching for buy opportunities against the key support areas mentioned.
For more detailed analysis join me, along with hundreds of other subscribers, at Mish's Market Minute and get my daily trade picks, trade alerts, training videos, and exclusive analysis tools. Sign up for Mish's Market Minute now and get a free 2 week trial!

Every day you'll be prepared to trade with: