July 11, 2011
Mish's Daily
By Mish Schneider
SPY Working off of an Island top that was established last Thursday. The candle stick term is called a Bearish Abandoned Baby. Typically, the trend reversal is confirmed by the black candlestick on the third day. There are other factors to consider such as the test and hold of the 50 day moving average at 131.85 with a declining slope yet a 10 day moving average which crossed above the 50 last week and has a strong upward slope. We also had a second distribution day in volume. SPY however, is the only one of the three indexes to have such a negative chart pattern.
QQQ did not have a distribution day in volume. It did not leave any gaps over the last couple of days. It also came very close to the swing high made in June at 59.34 with the high of 59.36 last Thursday before retreating on the close. The 50 day moving average, which is still considerably below today's price, has a slightly negative slope and the 10 day moving average which crossed above the 50 DMA a couple of days ago, has a strong upward slope. It is possible that we could see more of a correction down to 50 day moving average at 56.95. It is also possible that with a move above the floor trader pivot tomorrow at 58.16 we could see 58.55 where R1 is. The worst case is we are looking at the possibility of a double top, but we do not have confirmation through volume or price. The best case is we are having a correction.
IWM although this looks very similar to QQQ, it could not get close to its swing high at 86.82. Therefore, we are looking to the mid-caps once again as our next best indication as to whether this is a correction or the end of the rally. There are two very important fundamental aspects to the market right now-Earnings Season and the Debt Ceiling deadline.
Featured ETFS:
GLD once again maintaining a strong move up as the safe haven. All-time high at 153.61. Beginning to look overbought on the daily but not the weekly. Now good underlying support at 150.50.
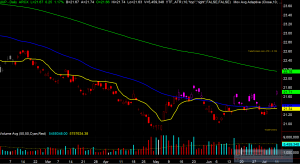
 UUP got long last week at 21.37 through options. Closed today at 21.71, above the last two swing highs back in June. Has some resistance at 21.86, with the 200 day moving average overhead 22.16 which is now sloping upwards- first time since last October. FXE broke the 200 weekly moving average with its close under 140.10. Underlying support at 138.45.
XRT* still has an upward sloping day moving average which is considerably far away from the current price. It's possible we'll see a move back up to 55.30 area, the lows from last Thursday and Friday.
IBB slope on the 50 day moving average has now turned slightly negative. After coming within two tics from all time high, it appears this sector and group has more correction in store before one can buy with confidence. Similar situation with IYR and IYT.
For more detailed analysis join me, along with hundreds of other subscribers, at Mish's Market Minute and get my daily trade picks, trade alerts, training videos, and exclusive analysis tools. Sign up for Mish's Market Minute now and get a free 2 week trial!

Every day you'll be prepared to trade with: