July 6, 2017
Mish's Daily
By Mish Schneider
 Leading up to the impending stock market crash, by February 1929, one million Ford Model A’s were sold and by July, two million.
The original toolkit from the Model A looks practically medieval.
Given the October 1929 stock market crash, I suspect many Model A buyers used some of those tools on themselves in a medieval fashion.
Last night, we focused on the Transportation sector or the ETF IYT.
As of Monday, IYT’s price moved above the monthly chart’s channel line resistance.
That makes Monday’s low price 172.85 important, especially on a closing basis for this week.
Henry Ford focused on “design for manufacturability”.
The purpose of DFM is to address potential problems during the design phase thereby reducing manufacturing costs.
Today’s action had elements of archaic tool parts, elements of potential problems in the design phase and elements of welcomed reduction in costs.
As Transportation is my “go-to” this week, it outperformed the overall market and held the critical channel line.
Under the hood, however, the market might be using tools from 1929.
If so, what would make the bull market suddenly look medieval?
The Russell 2000 had a rough day. If the monthly channel line resistance at 142.90 disappears from view, we will know soon enough if that was the top.
There are several more modern tools to use to identify a top without having to sell the top tick.
For instance, besides monthly channels top and bottoms, I use phases. The daily phase and the weekly phase are fabulous tools for trading on the right side of the trend.
Currently, IWM may have failed the monthly channel chart. Notable is that it went into an unconfirmed warning phase on the daily chart. It is in a bullish phase on the weekly charts.
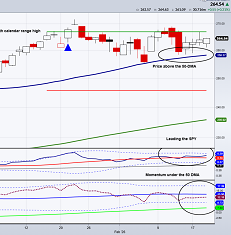
I like to consider the slope on moving averages. Although the S&P 500 went into an unconfirmed warning phase today as well, the 50 DMA slope remains positive.
I use the Economic Modern Family as well. Should IYT, Regional Banks (KRE) and Biotechnology (IBB) hold onto their bullish phases, I consider that more constructive.
Even with Retail (XRT) crushed this year, the market has divorced itself from brick and mortar weakness.
Yet, as a critical part of the Family, even though IYT IWM have been positive, I reduced the number of long positions and position sizing a few weeks ago.
On the flip side, given Retail’s weakness, should IYT, IBB and KRE deteriorate in phase, I will be more inclined to go short or buy inverse ETFs.
I also use 6-month calendar ranges. Auspiciously, July’s calendar range will be in place after the first 10 trading days of this month.
Therefore, if IYT heads into a warning phase with neutral to declining slopes on the 50 DMA, and XRT continues to fail, a break of the 6-month calendar range low could seal the deal.
A 2017 electric starter may not be as medieval looking as a 1929 handcrank. But they both turn a motor on and off.
S&P 500 (SPY) 244-245 resistance to clear. 242 pivotal Under 240 not so good
Russell 2000 (IWM) I’d still consider the channel resistance at 142.90 as the number to watch. 140 pivotal. 137.50 support
Dow (DIA) 214.25 pivotal. 212 support.
Nasdaq (QQQ) 140 resistance. 137 pivotal and 135 support
KRE (Regional Banks) Must hold 54.75 clear 56.00 once and for all
SMH (Semiconductors) 83.50 pivotal resistance. 80.75 support.
IYT (Transportation) 172.85 support to hold on a weekly closing basis. If not, will consider that a monthly channel top failure
IBB (Biotechnology) Trying to hold 310 area
XRT (Retail) 40.00 resistance 38.83 next support
GLD (Gold Trust) 115.50 support with a move over 117.25 interesting
GDX (Gold Miners) Its holding the 200-WMA. A push over 22 would be interesting
XME (S&P Metals and Mining) Through 30.60 seems like a good place to get long
USO (US Oil Fund) Inside day. 9.00 the ultimate support
TAN (Solar Energy) 19.00 should now hold if good. Must close above 20.00 to keep going.
TLT (iShares 20+ Year Treasuries) 124-125 resistance. 122.25 support
VXX (Volatility Index) We’ve seen so many false bottoms. But this did clear 13.30
UUP (Dollar Bull) 24.95 pivotal resistance

Every day you'll be prepared to trade with: