April 11, 2016
Mish's Daily
By Mish Schneider
Nothing would be finer than to be long this gold miner…
A departure from metaphors and allegories, I wish to give you all a glimpse into the book I have been busily writing. My plan is to have it available just in time for your holiday shopping list!
The book covers phases. Active traders will typically use daily charts to follow phases. In the many webinars I have taught, I too depict the 6 phases using daily charts. For the book, I branch out to weekly charts.
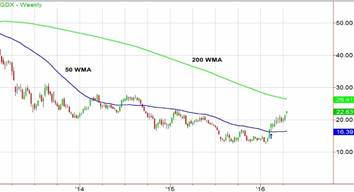
In the above chart, GDX or the Market Vectors Gold Miners ETF, you see a weekly chart with 2 simple moving averages-the 50 and 200-week MAs.
Why GDX?
Since late 2015, I have shared my thoughts about commodities as the “trade” for 2016. As a former commodities trader on several NY Commodities Exchanges, I follow the countercyclical setups between equities and commodities. This year, I was keenly focused on many commodities that have experienced protracted bear phases in contrast to the market’s protracted bull phase.
GLD, the gold ETF, became my first long position of 2016 in January at 104.35. The chart setup is similar to GDX.
For me, the best time to establish a long swing position trade happens at the end of a protracted bear phase once the instrument improves into a recovery.
Over the weekend, I featured the tangle web of the FED and Central Bank’s policy to keep feeding the market with zero to negative interest rates. Last week, three former FED chairmen along with Yellen met to discuss the global economy.
The cause/effect, should the market sputter more, is precisely what we have been witnessing thus far-the money rotating into commodities as a result of historically low rates and a weakening US dollar.
Whether the money flows into equities any more than it already has (the reason we rallied from the February lows) remains to be seen. At this point the indices are holding up, yet in heavy duty consolidation mode. But I digress.
GDX had a perfect technical setup. My favorite swing position trade is when I can wrap my head around the fundamental reasons for the trade. However, I time my way in using technical chart patterns. The Recovery Phase is my favorite.
The week of February 5th, GDX closed above the 50 week Moving average. The following week, the low price touched and tested the 50 WMA. Once the price cleared the 200 daily moving average, we got long. Our sell stop was the low from the week prior or under 14.11. As I like to do for most swing position trades, I used a wide stop. I do not take a first profit until we have at least a 2:1 risk/reward ratio.
The other advantage of the Recovery Phase is that it provides tremendous opportunities for more active traders to participate as well.
Along the way we have taken 2 profit targets, currently holding ¼ of the original position. The phase remains in Recovery which means it could easily accelerate to an Accumulation Phase. Adding to the position is a fantastic way to trade with a trend using shorter timeframes. What you do not want to do is exit the trade entirely unless it hits your trailing stop. Psychologically, it is harder for a swing trader to pay up after getting initiating the trade at much lower levels.
Nothing could be sweeter than to see her then to tweet her…in the morning
S&P 500 (SPY) 201.50 support. 204 pivotal. 207.14 point to clear
Russell 2000 (IWM) 110.50-108 trading range to break either way
Dow (DIA) 177.88 the point to clear with 174 closest support
Nasdaq (QQQ) 108.50-110 the stubborn trading range.
XLF (Financials) 21.70 the 50 DMA. Over 22.50 looks better
KRE (Regional Banks) 36.50 support pivotal and over 37.35 looks better
SMH (Semiconductors) Sideways which typically is better for continuation of the current trend when/if breaks out of consolidation
IYT (Transportation) Now it has to regain the 200 DMA at 140.06 if good
IBB (Biotechnology) The 10 DMA is at 269.75 which should hold if this has any more chance to rally
XRT (Retail) 43.30 the 50 DMA support
IYR (Real Estate) 78.10 recent high to clear. 77 support to hold
ITB (US Home Construction) 26.72 the 200 DMA
GLD (Gold Trust) Can I get a 120? Well, we did. 121.40 area next resistance if holds 118
SLV (Silver) 14.75 now support
GDX (Gold Miners) 25-26 should be next target if holds 21.00
USO (US Oil Fund) 10.15 now support. Over 10.80 should continue
TAN (Guggenheim Solar Energy) If can clear 23.14 with volume that would be interesting
UUP (Dollar Bull) 24.40 pivotal. 24.53 now a good trailing stop point if short

Every day you'll be prepared to trade with:


