November 1, 2011
Mish's Daily
By Mish Schneider
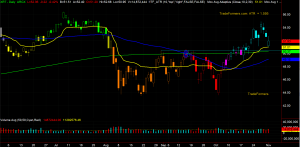
Islands everywhere. IWM UUP FXI AAPL for starters. But trading on that one pattern alone when the market goes up and down 100 like a slinky, can strip one of his/her shirt leaving one, well, bare chested. Most famous and lasting island top of late was the one in SPY in July. That is still in place. This also brings up another fact about bear markets-they can have the most vicious rallies. QQQ held the 200 DMA and are in an Accumulation phase. Other chart patterns have conflicting signs with islands, moves under the 200 yet holding the 50 DMA and positive slopes. And we now posted a third distribution day in volume.
SPY: Closed above 122.70 the 80 month moving average with a doji day.
IWM: 68.75 the 80 monthly moving average and now next support.
QQQ: Held the 200 DMA on a closing basis with next support 55.50.
ETFs:
GLD Back to warning phase but held the exponential moving average on the open and never looked back. Overhead, a declining 50 DMA.
SLV (Silver) If cannot clear 33.00 could see more downside.
FXI (China) Perfect example of an island top with conflicting signals since held a positive sloping 50 DMA.
TLT (20 Year Treasuries) FOMC minutes released at 2:15 EST.
SMH (Semiconductors) the weekly moving average coming back into play as a support level to watch.
XLF (Financials) Technically, still a gap and island top. But, a very interesting hammer candle.
 XRT* (Retail) Still the best looking sector/group.
OIH (Oil Service Holders) 121.00 support and resistance to clear 125.75
For more detailed analysis join me, along with hundreds of other subscribers, at Mish's Market Minute and get my daily trade picks, trade alerts, training videos, and exclusive analysis tools. Sign up for Mish's Market Minute now and get a free 2 week trial!

Every day you'll be prepared to trade with: