 Active investors and traders can learn a lesson or two from watching baseball, and...
This week on April 1, all 30 Major League Baseball (MLB) teams will begin their 2021 season and hopefully survive a full schedule of 162 games plus playoffs ending close to November 2021.
In both baseball and trading…
One way to win more often is to have an edge (a real statistical advantage) and play your game with strategies and tactics that exploit it.
Sometimes the edge has a short-term duration.
When it’s in play, you need to take action to capitalize on it.
Sometimes, playing with an edge requires a longer-term strategy of showing up and playing your game consistently with tactics that benefits from the edge.
The best of times come when short-term and long-term edges converge and compound in effectiveness.
The first steps in playing (trading) with an edge are knowing that it exists and then recognizing that it’s in play.
This Spring we’re hopeful that the professional baseball season will usher in the start of warmer weather, barbecues, swimming, boating, getting together with friends and family, and some sense of normalcy.
You may recall that the MLB only played 62 regular season games last year with no fans in attendance.
What you may not know is that…
An interesting edge for baseball players disappeared in the 2020 season, and even those who don’t know about this anomaly will be very happy to see it return in 2021.
I hope it returns because, like a “market truth”, it impacts how the game is played and enjoyed by even casual fans like me.
Even as a casual fan, baseball brings back great and vivid memories of growing up in NY.
I recall the “treat” of getting to go to a game and experiencing the sounds of baseball...the crack of the ball hitting the bat; the vendors calling out “beer here” and the smell of fresh cooked hot dogs with stadium mustard and of course the occasional bag of peanuts where I could throw my shells below me near my shoes.
I vividly recall the diehard fans tracking the progress of the game and the performance of the players with their scorecards.
They recorded everything - the number of hits, the batter’s records, the pitcher’s balls and strikes, and more.
These diehard fans recorded every player that touched the ball on every play.
Of course, every other fan watched the most popular statistic, the score, in the same way that the average investor focuses on the ups and downs of the Dow Jones Industrial Average.
But as a reader of this post, you probably know that the Dow is just the “tip of the iceberg” and the keys to building wealth in the market are found elsewhere…
The excitement of the game of baseball, and the manual recording of all the game’s action was very analogous in many ways to my days of being an independent floor trader following the markets with hand-drawn point and figure charts.
To this day, amid all the noise and excitement created by the fans and players, there is another game being enjoyed by people collecting data and anticipating outcomes.
Now, with digital scoreboards and big data computing power, we’re all a few clicks on our phone away from every baseball statistic known to man. This data describes the efficiencies of each player, the defense, at-bats, and more.
As a result, team managers can identify the most valuable players in baseball for any position and every game-time situation.
This is particularly powerful considering that if 2 or 3 players get “hot” with unstoppable batting or unhittable pitching, they can give the team enough of an edge to consistently win games.
The edge of having the right player at the right time is often compounded by the tendency players and teams to experience “streaks”, much like traders, investors and markets do.
In baseball, a good streak means better stats or more wins. In trading, it means a bigger account balance. Either way, it’s a “market truth.”
The proof of this “market truth” plays out every year as baseball moves into its post season and the hottest players are traded as frantically as the stock market’s swing traders are currently buying and selling shares in SPACS on the hopes of what they might become in the very short-term future.
Additionally, baseball managers play a never-ending game of tactically putting players in the game precisely when they believe they have an edge that will outperform the competition under certain circumstances.
PLAY BALL WITH US
Understanding baseball can make us all better investors.
Baseball games and markets are both full of streaks, surprises, and reversals of fortune. As a result, they can both become an emotional rollercoaster.
As I’ve suggested, they both also have short-term and long-term edges.
These ‘edges’ are conditions or sequences of events that are recognizable and give anyone choosing to identify them an advantage over those who ignore them.
As I began above, in 2020 baseball players lost an edge that has existed for over century.
This is what I was referring to…
Have you ever experienced a home team transition from a group of players quietly losing a game into a team of rock-star performers who can do no wrong as the sound of the stadium builds from a dull hum into a deafening roar?
Sometimes it starts with an exciting play like homerun.
Sometimes it starts with a simple base hit that puts a “tying run” on base, and that sparks a new feeling of hope for what could come next.
And sometimes…
It starts with the home-town fans deciding that it’s time to get loud to motivate their team.
Regardless of how it begins, once underway…
The events and the energy of the crowd that follows have a predictable pattern.
Players perform at their best.
The stadium roars.
And then… the home team often wins.
This is baseball’s home field advantage at work.
Sure, this sequence of events can happen for the away team, but…
Statistically, however, the away team doesn’t enjoy this edge.
I don’t bet on sports games, but if I did…
I’d place my bets on the home team when this comeback momentum is underway.
I do bet on market, and when I do…
I like to have a “home team” edge.
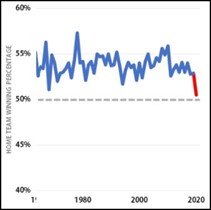
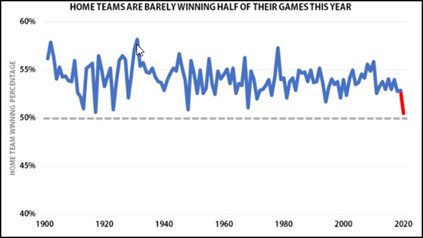
As you can see by the chart below, the home team has a statistical edge. Looking back over 100 years, the home team has won roughly 54% of the time.
Interestingly, and to further prove the point, in 2020 when fans were not able to attend games, the edge all but disappeared.
Of course, the markets don’t have a home and away team, but they do have ‘bulls’ and ‘bears’ and plenty of analogous conditions, sequences of events, and human emotions that lead to the same predictable result.
Since the obvious fuel for both the bulls and the bears is derived from the current and expected future political and economic conditions, let’s start there.
On the bullish side…
On the bearish side…
Important factors that could support fuel bullish or bearish sentiment…
With all that in mind…
Who’s got the home field advantage? Bulls or bears?
For better or worse, answering that question by betting on the direction of the whole market is just one of many ways to make money in the market.
Additionally, as a trader or active investor, you need to be clear about whether you’re placing your bets on an edge that is relevant to the baseball equivalent of whether or not the next batter will get on base, or your team will win the current inning, game, series of games, or even the whole season.
At MarketGauge, we’re careful to match our strategies, automated trading models, and tactics to the time frames in which they have an edge, and therefore, also outperform.
For example, if I were to describe the MarketGauge mechanical models using baseball analogies….
As an active investor, it’s important to be aware of what strategy you’re using and why. This ensures that you stay disciplined, which is important for being profitable over the long-term.
Each strategy will, at times, enjoy its own home field advantage, but you also need to recognize that there will be more difficult times too. This is why position sizing and diversification is important.
Finally, you don’t need to choose to play with only one strategy. Diversifying into more than one strategy can reduce your portfolio's volatility.
As the market pulls back, it’s a good time to review the strategies you’re employing and why to help maintain good discipline, diversification and position sizing.
If you have any questions, don’t hesitate to reach out to us for help.
Here are this week’s latest highlights:
Have a great weekend and best wishes for your trading.
Here's your Premium video: