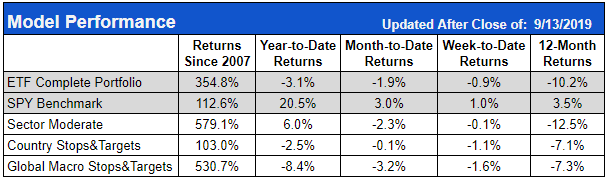
In the example above, the equity puts in a new “peak” high at $1,200 in July. Over the next couple of months, the equity sells off down to about $1,050. This happens to be the lowest it sells off to before it puts in a new high a year later, but we cannot declare that low as the maximum “peak-to-trough” drawdown until we see it put in that new high. The time to recovery is simply the length of time between when the equity puts in a peak high and then finally puts in a new high.
The frequency and severity of drawdowns can play a big role in how hard or easy it is to stick with a trading system. Frequent, deep drawdowns can test your resolve to stick with a longer-run winning system. Expectations also play a roll. If you go into a trade expecting a particular or high level of volatility, you can risk and position-size accordingly and stay with the plan.
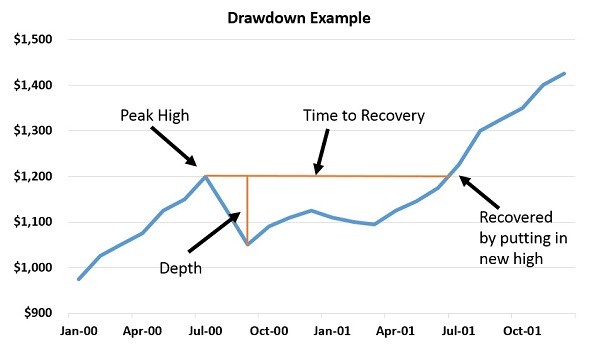
Largest Historical Drawdowns
The SPY and ETF model data goes back to 2007. This includes the 2008 financial crisis (which shows up in SPY’s largest drawdown). Many the ETF models had their largest drawdown in 2015 from a combination of a steep sudden market decline and a mini flash crash that disrupted normal market processes.