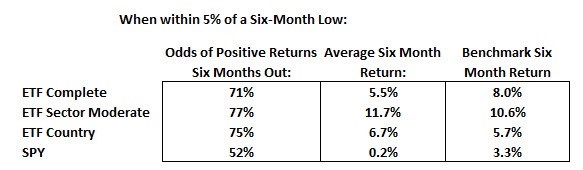
When looking at the flipside of these statistics (markets trading near their short-term lows), we see some more dramatic changes in performance, particularly for the SPY. Over our sample period from 2007 to 2017, the average SPY six-month performance was 3.3% versus 0.2% when its trading near its lows. The steep and protracted decline in 2007 through March 2009 was responsible for pushing this statistic lower than it would have otherwise been in the last few years. If we excluded that period, we would see significantly more mean reversion in the data from the lows as most of the market corrections since then were shorter and, at least in hindsight, turned out to be good buying opportunities.
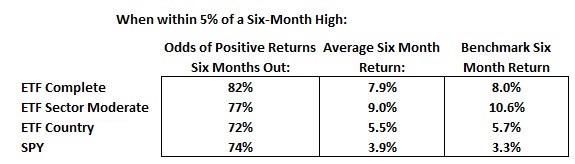
Overall, you certainly can make a stronger case for caution when markets and the models are near their lows, though we still see generally positive outcomes and averages don’t always tell the whole story. Also, not all models spent the same amount of time in these high or low states with significant differences in the number of observations for each.
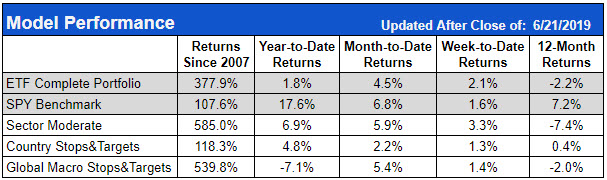
These statistics back up the idea that you don’t have to rely on perfect market timing or luck to profitably trade the ETF models. The inclusion of short and alternative instruments help balance the portfolio when markets are correcting, while the strength and persistence of trends can help keep the engines running when at new highs.
Hopefully you found this series helpful in starting and managing any of these ETF portfolios. If you ever have any questions about any of these topics or others, feel free to contact us via email or messaging or you can ask questions in our live monthly coaching sessions.