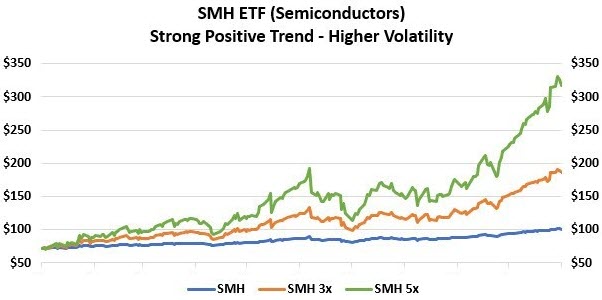
For this scenario, we look at period in the SMH ETF and some simulated 3x and 5x returns. SMH is an ETF tracking the semiconductors industry. Semiconductors are essential parts of all computers, cell phones, and other electronic devices. This industry has been hot for a while and has posted strong recent gains.
During this period, SMH was up about +40%. A simple 3x multiple would be +120%. The actual 3x daily leveraged return is +160%. A simple 5x multiple would be +200%. The actual 5x daily leveraged return is +342%.
The difference is caused by the multiple periods of compounding. Here, in a strong uptrend, this compounding works dramatically in our favor. The 5x leveraged daily compounding resulted in a final gain that is 8.4x larger than the non-leveraged return.
This “extra” leverage through compounding multiple periods in a positive uptrend is not just theoretical. The ETF Sector Aggressive model had a stellar trade in the leveraged ETF SOXL that lasted almost two years.
Over that period, the unleveraged semiconductors ETF was up about 60%. A simple 3x multiple of that return would be around 180%, however, the 3x daily compounded semiconductor ETF was up 281% over that same period.
With the positive leveraged compounding, the 3x daily leveraged SOXL returned a 4.74x multiple return compared to the non-leveraged return of SMH over the same period.
The decay from volatile side-ways periods means you probably don’t want to arbitrarily “buy and hold” a leveraged ETF, though it is clear that the leverage and compounding works in your favor in a positively trending market. These are the type of markets and moves we are looking for and attempting to identify with the Trend Strength Indicator in the ETF models.
Next week we are going to wrap up this series reviewing how leveraged ETFs perform relative to the non-leveraged versions and cover some of the other factors that can cause divergences between the two.