November 3, 2015
Trades & Tutorials
By Geoff Bysshe
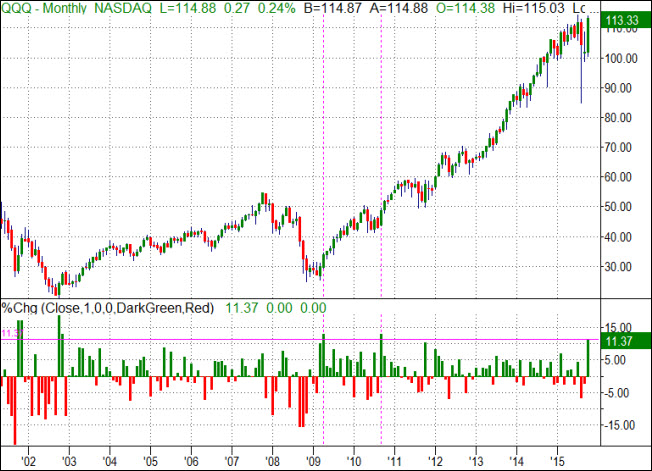
The media has chosen to describe the October move in the QQQ's as the "the biggest move in 4 years". This is true, but I think the more impressive fact is that a move of over 11% in any one month has only happened twice since November 2002.
Interestingly, October 2002 also posted gains of over 11% and marked the low of the bear market which began 2.5 years earlier when the Internet bubble burst. Along the same line of thought, I like to look at how the market was set up before its notable move and what it did afterwards.
In other words, as I often do in this blog, this post provides you with a little more perspective on the QQQ's big October move. At the beginning of October I suggested that this year was set up to be a very bullish October if history was any guide in this post.
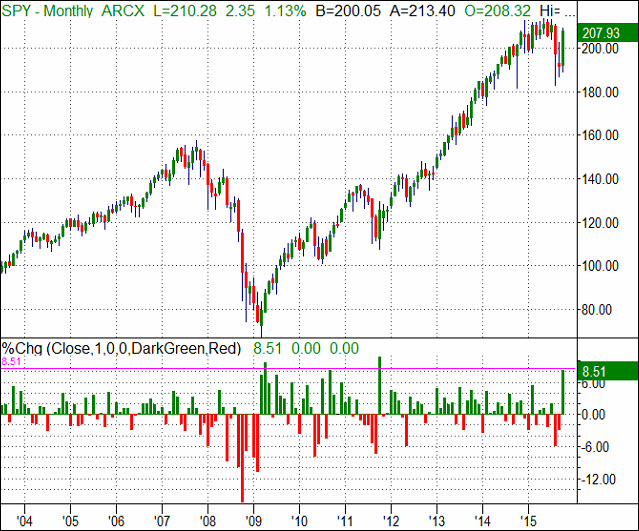
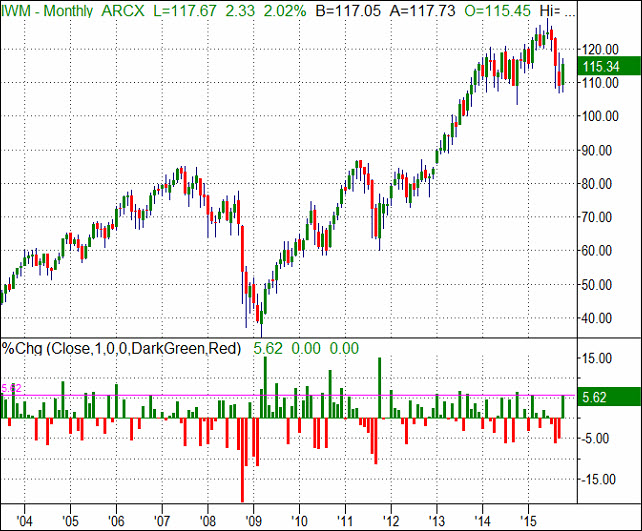
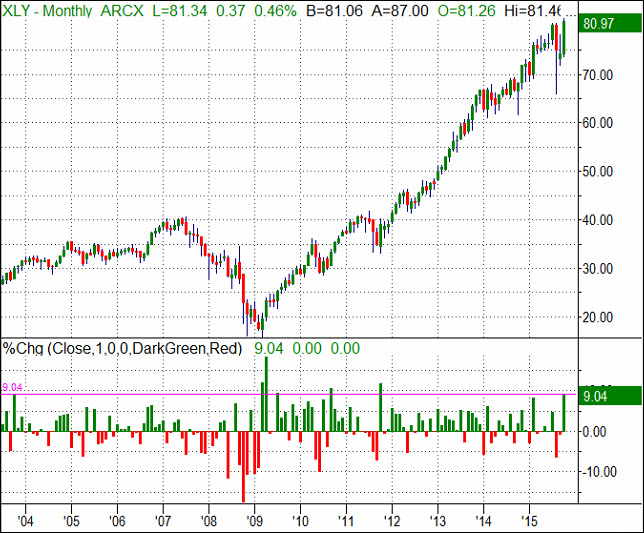
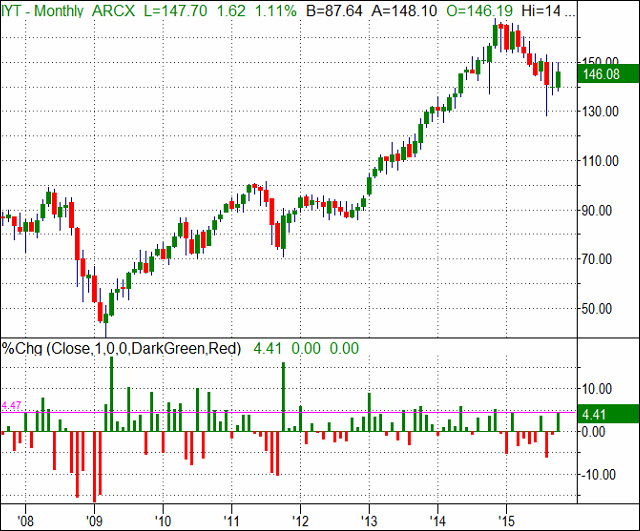
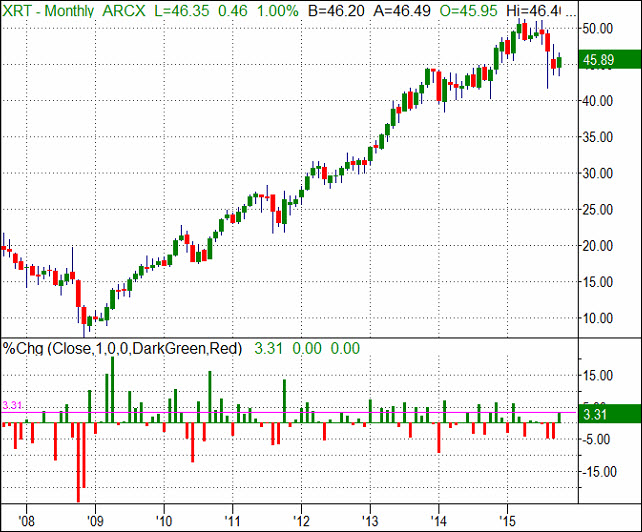
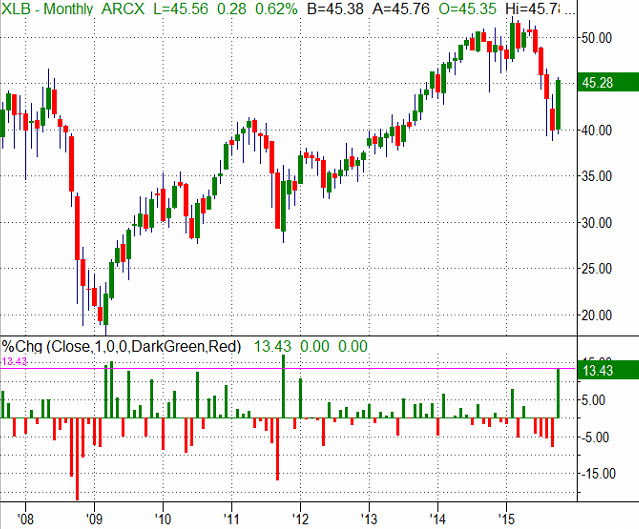
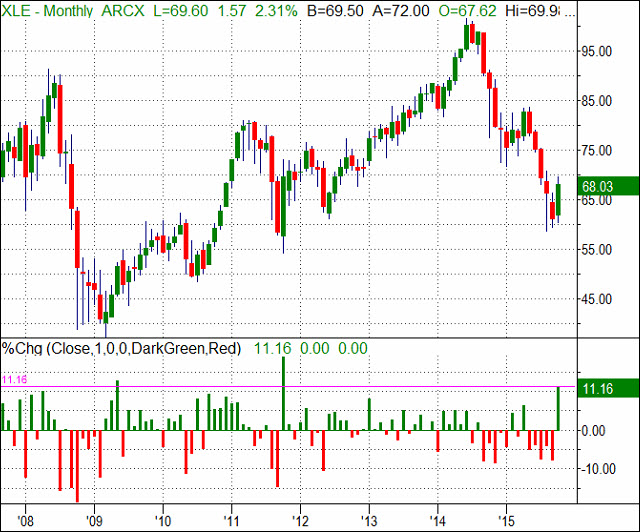
In the video and charts below you'll see just how "outstanding" October was and how other markets and sectors performed in October and historically.
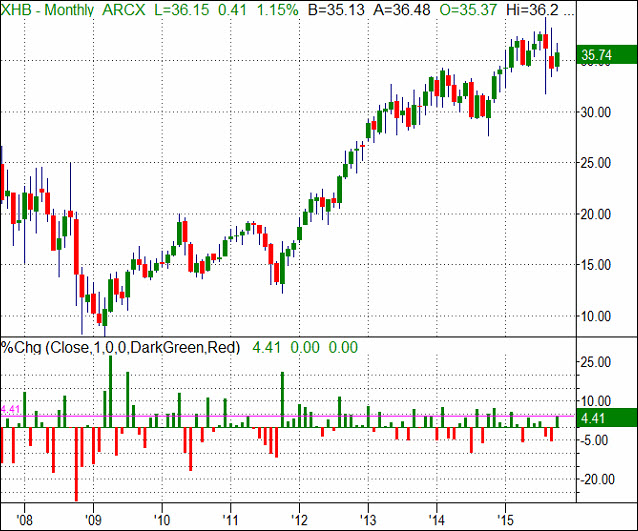
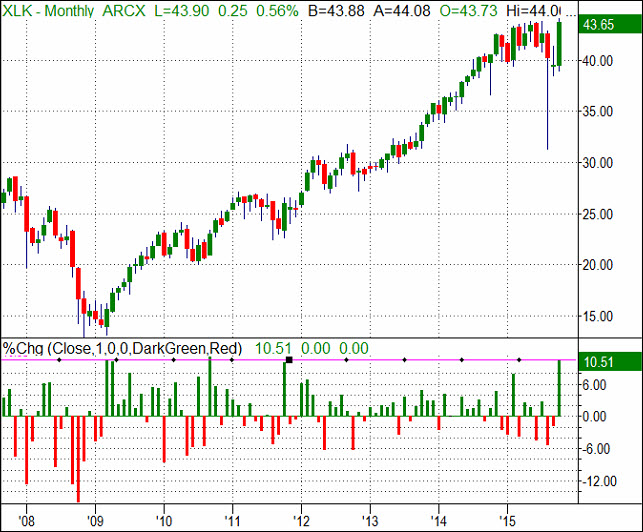
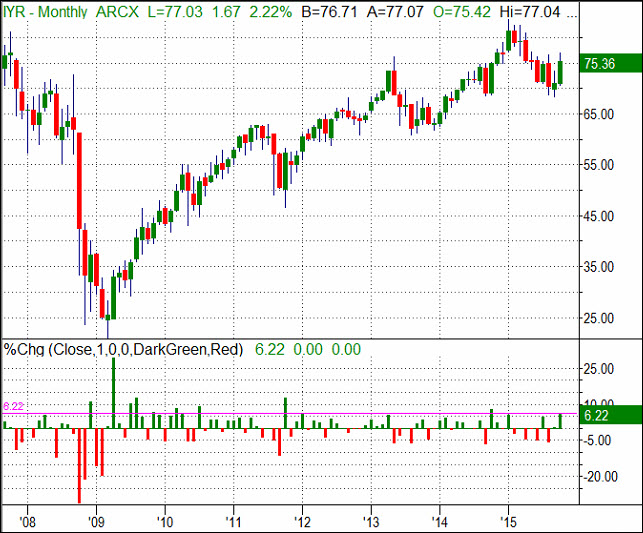
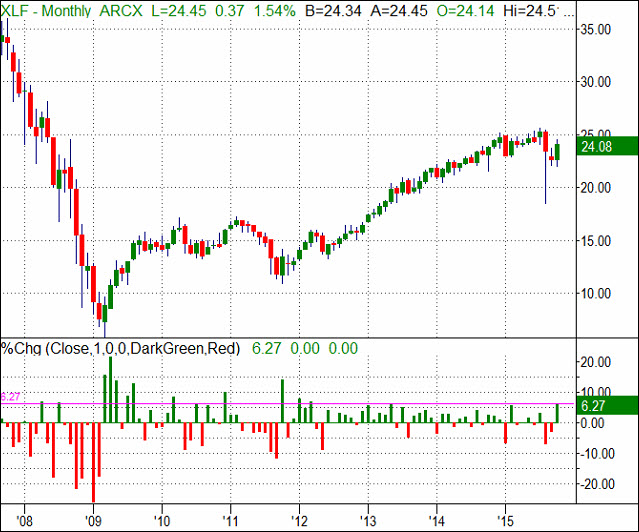
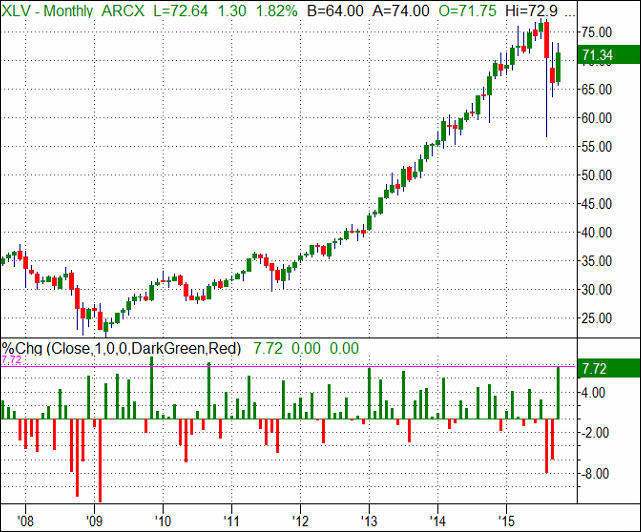
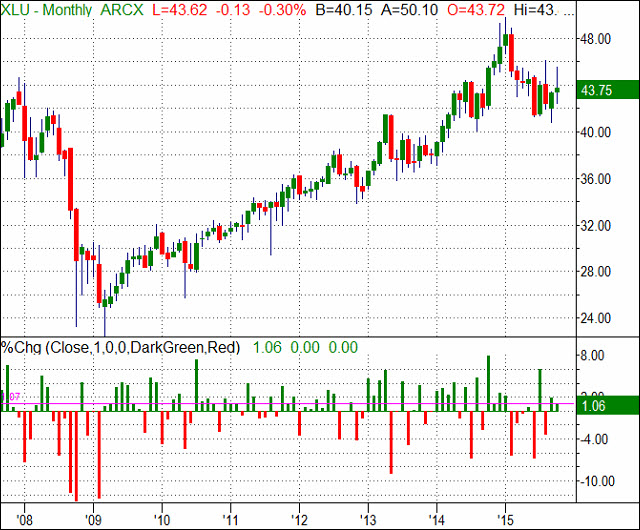
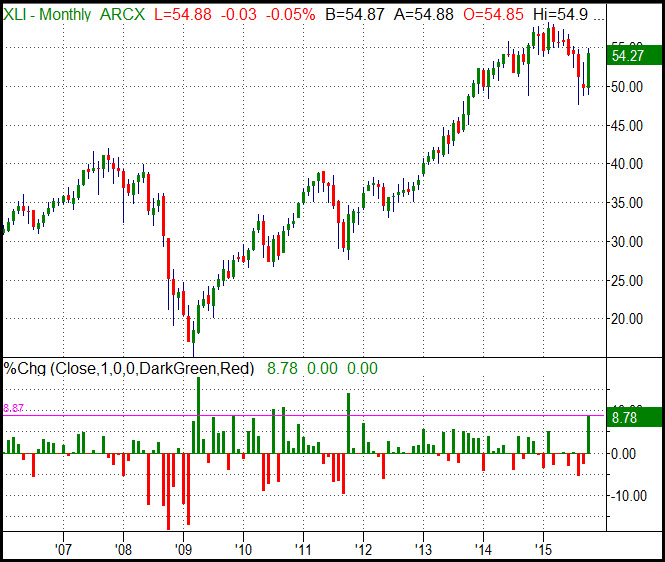
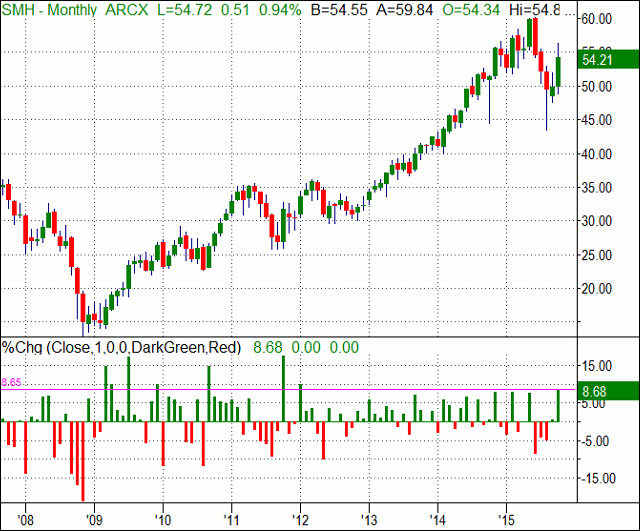
In the charts below you'll find monthly candlestick charts with a histogram at the bottom of each chart that represents the percent change for the month so that you can easily compare each months performance. The magenta horizontal line represents the October performance for an easier comparison to its past months.
In addition to the observations made in the video, I'll point out that a "good month" in the QQQ would be about +4%. However if you look at the 4% gain level for industry groups you'll find this happens quite frequently. This is one reason our ETF Sector rotation trading systems are able to dramatically outperform the market.
If you'd like to learn more about our ETF Sector Trading systems click here and we'll send you an email invitation to our next training webinar.