March 1, 2026
Weekly Market Outlook
By Geoff Bysshe

Last week, earnings season “ended” with a disappointing reaction to the much anticipated Nvidia earnings.
However, the market’s reaction to Nvidia’s earnings, and the less-covered economic news, gave the savvy investor information that clarifies the market narrative and helps anticipate the direction of the next market trend.
A few of the highlights we'll cover this week include:
.
The Current Context
A year ago, a big beat on EPS and revenues, along with a better-than-expected improvement in guidance by Nvidia, would have surprised the market and sent it and the market soaring higher.
Those days didn't end last week; they ended two quarters ago.
In the chart below, you can see prior earnings days marked with magenta vertical lines.
If you're familiar with MarketGauge’s indicators of real motion, triple play leadership, and volume trend, you'll notice that in each of the last three earnings announcements, they were not particularly bullish and, in some cases, quite bearish going into the report.
So while Nvdia has been knocking it out of the park with the growth of its business, the market’s appetite for it and other AI leading stocks has diminished.
The changing environment isn’t a secret. The MAG 7 stocks, represented by the ETF MAGS can be seen struggling since last October in the chart below. The magenta horizontal lines represent Nvidia earnings dates for context.
While the Magnificent 7 stocks struggled because of the market's concern over their excessive capital expenditures and potential pressure on future margins, AI became an even bigger headwind to other areas of the market.
Friday's close is the first time since last May that MAGS has closed under its 200-day moving average.
In what has been labeled as "AI derangement syndrome", by market strategist Ed Yardeni, AI is now viewed as a threat to many stocks, industry groups, and even the economy.
The most prominent example of this has been the implosion of enterprise software stocks as represented by the ETF IGV shown below.
Certainly, smarter software, more rapid software development, new technology needs, and more could pose a threat to legacy software companies.
However, there are a few simple reasons to suspect that it's time to expect the market to sort out the real losers from the collateral-damaged stocks.
If IGV trades over $83 with some basic confirmation tactics, the bounce is likely to begin. More opportunistically, it would be time to focus on the best stocks in the group.
Why Isn’t The Whole Market Falling?
On many days, the news sounds dire because the cap-weighted, most popular tech stocks are under pressure, but as we’ve been pointing out for weeks here. This is not the same bull market that began years ago, and the broader market is still strong.
This is most obviously demonstrated by the equal-weight S&P 500 index ETF (RSP) shown below. It closed at an all-time high on Friday.
Even parts of tech are strong. For example, Nvdia’s home turf, semiconductors, has remained a leading group. You can find the chart below and most major sectors in the Big View Sector Summary section
Both Real Motion charts in SMH are weak, so any break below the 50 DMA in price would be dangerous, but as of right now, SMH is a fw percent and 2 days away from its highs.
Earning Season Supported A Broader Bull Market
Earnings season delivered solid results beyond the Mag 7 as shown in the chart above. Looking forward analyst are raising EPS estimates in the quarters Q2 – Q4 2026 as shown in the chart below.
Revenues also continued to accelerate into last quarter as shown below.
What To Keep An Eye On
Analysts expect EPS to grow through 2026 (as shown above), but they expect revenue growth to decelerate (as shown below). That said, the expected growth rate is still well over 7%, which remains elevated relative to the last several years.
Is The Economy About To Surprise To The Upside?
Last week, there was important economic news relating to growth and inflation, which sets the stage for the important news coming this week.
The strength of the economy, which will impact the expectations for revenue and EPS growth, is debatable, but it has continued to surprise skeptics.
Earlier this month, the ISM Purchasing Managers Index (PMI) hit its highest level since 2022 and unexpectedly jumped over 50, which is the level that divides expansion from contraction.
Last week, this strength was supported by the Chicago PMI, which registered its second consecutive strong month. Chicago is viewed as a leading indicator for the ISM.
Investors have digested the idea that the Fed is not likely to cut rates for the next several months with no real conviction of when the cut will come. In this scenario profit growth and economic growth are critical.
These are even more important if inflation remains “sticky” since that would make it more difficult to justify cutting rates.
Last week, Core PPI reported the highest back-to-back reading we’ve seen since 2022.

Additionally, non-core PPI registered back-to-back elevated readings shown below.
The concern isn’t the level so much as the potential development of an upward trend and that it makes the Fed’s decision to lower rates more difficult if economic growth is in question.
The Next Big Data Point
That leads us to this week's labor market reports.
The market is already spooked by the idea that AI is going to wipe out jobs, so a number weaker than expected may get extra attention.
However, last month non-farm payrolls (shown below) recorded a much higher than expected number of jobs (130k vs an expectation of 66k). While this is a welcome surprise, the month-to-month numbers are not only volatile but also questionable given the disruptions of the recent government shutdown.
Expectations for Friday’s report are 58k, which would not change the chart's trend below, but another 100k+ number would.
The Wild Card of War
It’s no surprise that the U.S. and Israel started a war with Iran this weekend, but there is also no reliable expectation for how this conflict will evolve or be resolved.
Historical safe havens (the U.S. dollar, Treasury Bonds, gold, etc.) and scarcity-driven resources (oil) are likely to be bid up initially. Stocks are a tougher call in the short-term, but a longer-term perspective suggests the war is less of a concern than the primary drivers of stock prices – consumer spending and corporate profits.
Of course, a war can have an impact if it affects the primary drivers of the market, but be careful not to jump to conclusions, overestimate its impact, or underestimate consumers' and corporations' ability to adapt and thrive regardless.
In times of high uncertainty, like now, it's important to have a plan, the discipline to follow it, and risk-management rules to ensure you adapt if needed.
Want Help?
If you'd like access to the MarketGauge indicators, strategies, automated trading models, and more, contact us.
Best wishes for your trading,
Geoff Bysshe
Co-Founder
(I also post on Linked In)
 |
 Every week we review the big picture of the market's technical condition as seen through the lens of our Big View data charts. Every week we review the big picture of the market's technical condition as seen through the lens of our Big View data charts.
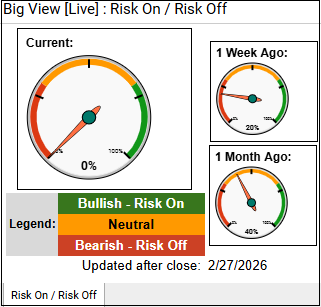
The bullets provide a quick summary organized by conditions we see as being risk-on, risk-off, or neutral. The video analysis dives deeper. |
Summary: How the Global Equity markets react to the outbreak of war in the Mideast remains to be seen as its severity and how long it lasts is unknown, with upward moves in oil and precious metals seem most likely.
Markets show a fragile risk-on backdrop supported by constructive volume trends, resilient market internals, and strong foreign equities, but weakening momentum and multiple indexes trading below their 50-day averages signal a loss of upside conviction. Rising defensive sector leadership, strengthening commodities and precious metals, negative risk gauges, and seasonal headwinds suggest a cautious environment where capital is rotating toward safety despite markets remaining largely range-bound.
Risk On
Neutral
Risk Off
Adopt a cautious, tactical stance — markets are range-bound with weakening momentum and rising risk-off rotation, so favor selective exposure rather than aggressive directional positioning.
Increase exposure only if:
Reduce exposure if:

Every week you'll gain actionable insight with:


