March 29, 2026
Weekly Market Outlook
By Geoff Bysshe

Where Persistence Has Become A Big Problem
If you’ve been following this article over the last several weeks, you may have noticed a theme that focuses on the importance of time as an influence on market behavior.
Time in a trend affects sentiment, positioning, and more.
The fundamental factors behind the market’s trend are also likely to be affected over time, as is the case with the persistence of the Iran war and the elevated price of oil, both together and independently.
Few would argue that the higher price of oil, driven by the war has depressed stock prices and expectations for global economic growth, but how quickly the market and economies will recover should the war come to an end in the next week, month, quarter, or longer is debatable.
However, the longer the war goes on, keeping oil prices elevated, oil production declining, and the flow of oil to importing countries curtailed, the bigger the problem becomes.
Higher oil prices are an obvious problem, so when the war ends, the next obvious question will be, When and for how long will oil prices fall?”
There’s never one reason for a price trend, but below you’ll find a visual analysis of the relationship between the changes and levels of OECD Oil Inventory Data and the price of crude oil. Note that this data excludes strategic reserves in order to put more focus on the open market source of oil.
As you can see there are three measures.
The top chart shows the level of commercial stocks (inventory excluding strategic reserves) and the price of oil. It’s clear that the price of oil is inversely correlated with the level and trend of inventories.
The middle chart shows month-to-month changes in inventory along with a three-month average of the monthly changes and the price of oil. Again, the price of oil is highly correlated with the 3-month average trend and level of inventory changes.
The bottom row has two charts that give the correlation data for the one-month period and the total level. Here you can see clearly that one-month changes aren’t a problem, however, the cumulative impact over time is highly correlated.
A persistent trend of declining inventories is a problem that leads to persistently higher oil prices.
In case you didn’t notice, the reporting of data lags by a couple of months. So while this is the most recent data, it doesn’t include the impact of the war.
How Will This Market Bottom?
There are three common ways market corrections and bear markets bottom out.
The investors and the media are looking out for capitulation (number 1), but the market is saying it prefers rotation right now.
In other words, while the market is trading like a bear market and the media’s reports often sound dire, the market is not selling everything in a rush of capitulation.
If you’re only looking at the S&P 500 or NASDAQ 100, it may feel like capitulation is underway, but the broader market tells a different story.
As a result, the process of sector rotation can indicate when the market has bottomed and or when the market slides into a state of capitulation.
When Will This Market Bottom?
In last week’s Market Outlook, we introduced the PRIME Framework for analyzing a market’s trend to determine whether it is likely to continue or reverse.
As with most good frameworks or methodologies, it has basic principles you can use immediately to improve your market analysis. Additionally, with experience, you’ll discover several levels of detail that make the PRIME Method even more powerful.
The basics look like this.
The PRIME framework is based on 5 primary conditions that influence a stock’s or market’s trend. They are as follows:
The PRIME method provides a simple way to measure all five elements:
This market will have established a reliable bottom when three of the four top PRIME criteria are bullish in the indexes, and or when several growth-oriented sectors are also in bullish conditions based on the PRIME criteria.
On Monday morning, in our live mentoring service, I reviewed the major sector from the PRIME perspective. We’ve posted a recording of that analysis as this week’s Market Outlook video.
Here are a few sector charts explained.
XLE, the energy ETF, is a good example of what a clear breakout looks like with all the PRIME indicators in a bullish condition. The charts that follow are not very bullish, but they are showing signs of holding or turning in a market where the indexes (SPY and QQQ) are very bearish.
XLP, Staples, is a defensive sector, but it’s holding its 200 DMA while the market trades much lower than its 200 MA. Real Motion moving averages often identify support areas, so the Real Motion chart on the 200 MA is significant.
XLB, Materials, has moved over its 10 DMA and the Real Motion 10/50 momentum indicator’s green dots confirm there may be enough momentum to continue higher.
Additionally, the leadership indicator has a bullish reading, which suggests the sector’s improving price action is NOT a result of following the market. This conclusion is easy and obvious in the current bearish market environment, but when the market is trending higher, a leadership indicator with this pattern highlights the strongest trends.
XLU, utilities broke down below the important support shown by the dotted line. However, it held its 50 DMA and maintained its strong leadership condition. If XLU trades over its 10 DMA and the resistance of the breakdown level, Real Motion is in a position to turn bullish, which would create a very bullish chart.
For more detailed analysis on more sectors, watch this week’s Market Outlook video below.
You can also access the charts shown here for free every day under the Big View Sector Summary Table.
Stocks That Can Do Well Now and When The War Ends
One way to apply the PRIME method is to focus on stocks in leading trends with a compelling growth story.
The AI driven trend of data center construction has created enormous growth prospects for the Fiberoptics industry. Three companies that are well positioned to experience strong growth for the foreseeable future in this industry are GLW (Corning, Inc), CIEN (Ciena Corp.) and AAOI (Applied Optoelectronics, Inc.).
Despite the war and weak market, these stocks have had large moves higher over the last month. As you’ll see in their charts below, they all pushed higher with “all bullish” PRIME conditions.
Timing trades is based on price patterns and trading strategies. The PRIME indicators highlight when the conditions for a strong trend or reversals exist.
In the last week, these stocks have begun to pull back, and some of the PRIME conditions have turned bearish.
This creates opportunities to buy a correction in a strong long-term trend when the intermediate and/or longer-term trend resumes its up move as defined by the PRIME indicators.
Below you’ll find a quick analysis similar to what we did on the sector charts above. You’ll also find links to a report with more extensive analysis.
GLW, Corning, Inc
GLW has a strong growth story.
It’s technicals have deteriorated but they could recover quickly:
The weakness in the market over the last 2 days has pulled GLW back under the 10 DMA (magenta) and down to the 50 DMA.
Warning: Both Real Motion indicators have red dots (bearish) under their 50 DMA while the price chart sits over its 50 DMA. This condition suggests that if the price breaks its 50 DMA, it will continue lower.
However, if price moves back over its 10 DMA and the Real Motion charts turn green, everything will be in gear for a new move higher.
For a more detailed analysis, go here
AAOI, Applied Optoelectronics, Inc
AAOI has a very similar situation as GLW above, but its momentum is stronger, and it’s further from its 50 DMA.
If it climbs back over its 10 DMA and the $100 level that has been pivotal, the price action will suggest it’s ready to move higher. If that happens with bullish reading in leadership, volume, and Real Motion, it will have all the ingredients of an explosive growth stock.
For a more detailed analysis, go here
CIEN, Ciena Inc.
CIEN’s growth story is strong, but it’s led by its sales growth:
Its technical setup is also very strong:
CIEN has had a very consistently strong 2026, as seen by its Leadership and volume trend indicators, having a solid trend, and the red line remaining well above the blue line.
The recent pullback under the 10 DMA has landed right on a good level to bottom - the support of the $360 level, which was its February swing high.
Leadership and volume trend remain bullish and while the Real Motion momentum measures have turned negative, they are at levels that are likely to be support. If CIEN gets back over its 10 DMA and $400, it’s likely that everything will be lined up for a continued move higher.
For a more detailed analysis, go here
As the market corrects, you can see if these 3 stocks and other market leaders are ready to resume their uptrend by looking at how their PRIME trends hold up or deteriorate.
Want Help Making Sure You See What’s Coming?
If you'd like access to the MarketGauge indicators, strategies, automated trading models, and more, contact us.
Best wishes for your trading,
Geoff Bysshe
Co-Founder
(Connect on LinkedIn)
 |
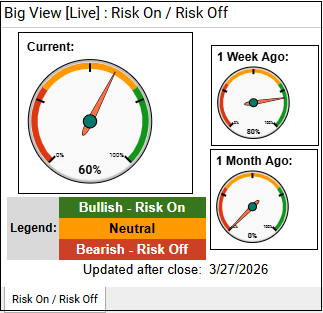 Every week we review the big picture of the market's technical condition as seen through the lens of our Big View data charts. Every week we review the big picture of the market's technical condition as seen through the lens of our Big View data charts.
The bullets provide a quick summary organized by conditions we see as being risk-on, risk-off, or neutral. The video analysis dives deeper. |
Summary: Despite markets making new lows and broad risk-off signals dominating—rising volatility, weak breadth, sector rotation into defensives, and higher rates—there are modest signs of stabilization with improving internals, resilient “modern family” components, and relative strength outside the U.S. Overall, conditions remain pressured and oversold with a bearish tilt, but divergences and seasonal tailwinds suggest the potential for a near-term bounce rather than continued straight-line downside.
Neutral
Risk Off
Core Positioning (Bias: Risk-Off but Oversold Bounce Potential)
What to Do Now
Bounce Strategy (Primary Opportunity)
Risk Management
Tactical Tilt
Bottom Line
Play for a short-term bounce within a broader risk-off regime, using strength to de-risk and reposition rather than assuming a durable trend reversal.
A Different Weekly Video: This is an excerpt from the Monday mentoring session from the Active Investing Edge membership

Every week you'll gain actionable insight with:


