April 19, 2015
Trades & Tutorials
By Geoff Bysshe
Stocks got smacked on Friday for a host of reasons including:
But as ugly as this one day of news may sound, the real concern lies elsewhere.
Tap here to read more and watch this week’s Market Outlook video.
As you’ll learn in this week’s video...
The down day on Friday left the SPY, QQQ, and DIA all under their 50 DMA. However, this is not the most concerning condition that has now been created in the charts.
The down day clearly demarks the second consecutive move to new highs by the IWM in as many months that has not even been closely accompanied by any of the other indexes.
Divergences this glaring are often a sign of a tired, indecisive, or even bearish market. The bull market is not completely broken, but bullish traders had better know their trading rules that protect their capital. In its fragile state, the market will be shaken by news from China or Greece.
I’m referring to the markets as in a fragile state because the real source of strength for the market comes from the expected direction of future earnings and/or U.S. economic data.
When earnings and the economy are expected to improve, dips in the market created by news like we’ve seen from China or Greece is an opportunity for the Bulls.
Unfortunately, as you can see from the chart below, the flow of economic data has hit a bit of a “soft patch” (Wall St. gibberish for unexpectedly negative!).
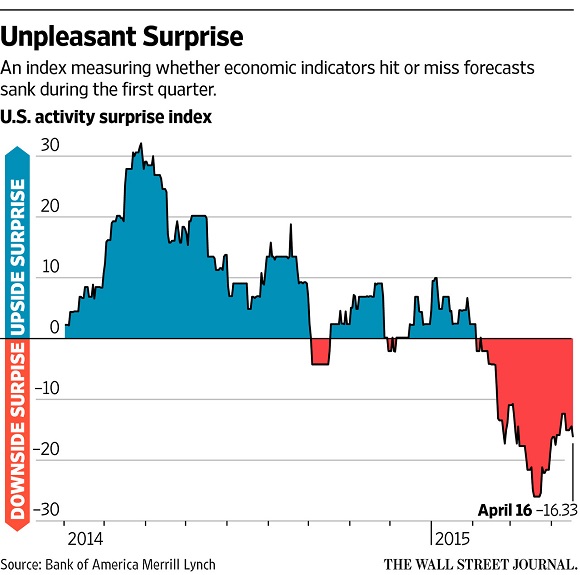
The chart clearly shows that since February of this year the economic data has been, quite simply, disappointing. In fact, the Wall Street Journal article that published this chart stated that...
“Analysts at Bank of America Merrill Lynch calculate that the number of disappointing economic reports relative to positive surprises has been greater in recent months than at any point since the expansion began in June 2009.”
The bearish view of this chart is that the market is finally rolling over and responding to the fact that the economy is not as healthy as expected.
The bullish view would be “bad news, good action” as the market has continued to go up since this chart peaked May of 2014.
I’ll let you decide which side you’ll take, but...
Before you assume your interpretation will lead you to the next major move in the market be sure to consider earnings!
Beware... The data below shows that of the top 5 weighted stocks in the QQQ, 4 of the 5 account for nearly 18% of the index’s value, and they all report earnings on Wednesday or Thursday of this week.
Next, if you include the #1 weighted stock in the QQQ (AAPL) you’ll account for over 30% of the index and it reports next Monday (4/27).
AAPL 14.49% (4/27)
MSFT 6.67% (4/23)
GOOG 3.73% (4/23)
FB 3.67% (4/22)
AMZN 3.45% (4/23)
In other words, over 30% of the QQQ’s value reports earnings within the next 7 days!
So now take a few minutes to consider the price ranges I highlight as the most important levels to watch in this week’s video, and let the market action tell you which way it wants to go in the context of more important issues than China or Greece.

Every week you'll gain actionable insight with:


