April 12, 2026
Weekly Market Outlook
By Geoff Bysshe

After intense negotiations over the weekend with Iran, the end result has been an announcement that the U.S. will blockade the Strait of Hormuz.
A few weeks ago, this news would have likely sent the stock market tumbling. Now, however, it will likely be viewed as a little more than a speed bump, as the market races into earnings season.
The market’s message last week was very clearly one that looked through the risks of elevated oil prices and the Iran war, and focused on the risks and benefits of the AI revolution across various sectors of the economy.
Stocks Put The War On The Back Burner
In last week’s Market Outlook, we highlighted the market rotation that was forming a bottom, and economic news that could support a more bullish market narrative.
This was supported by the fact that the bond market had also stopped going down in the face of higher crude prices and other news that would normally put pressure on rates to move higher.
The market was ready to rally before the ceasefire news so the welcome catalyst created a strong rally that held up and followed through in the indexes and several key sectors.
The war’s market bottom is in. Now it’s up to earnings to keep the bull market intact. With earnings taking center stage, the economy, interest rates, and inflation will be the supporting cast of characters.
Wall St. vs. Consumers On Inflation
Everyone is expecting higher oil prices to lead to higher inflation in the near term and Friday’s CPI data proved this to be true.
As you can see in the month-over-month CPI chart below, last month's data jumped significantly.
Shown below, the year-over-year measure also has an accelerating look to it as it jumped to the highest level since early 2024.
If the chart below were of a stock’s price, the technician would surely suggest there is strong support at the 2.5% level, and the bounce suggests more upside ahead and little chance we’ll see the Fed’s 2% target any time soon.
Typically, higher inflation leads to higher interest rates, potentially slower growth, pressure on stock multiples, and more reason for stocks to retreat. If the cause of inflation is consumer demand, then stocks have a justification for moving higher, but that's not the case here.
However, the big monthly jump of 0.9% in CPI inflation didn’t phase stocks, bonds, or expectations for Fed rate cuts in 2026.
The muted reaction by the markets is most likely because:
Looking at the Fed Funds market’s odds of rate changes, you can see that there were no significant probability changes as a result of any of last week’s news, including the CPI data.
The table below shows the odds data at the end of last week and the week prior. The blue shading shows the rate with the highest probability for the given Fed meeting. The meetings that show any changes are in 2027, and even the odds within the blue boxes did not change meaningfully.
The Consumer Disagrees
While the markets seem complacent about inflation, the consumer sees it differently. The University of Michigan Survey of Consumers’ expectations for inflation one year in the future reported a value of 4.8% which is much higher than the 4.2% expected and breaks a long downtrend in expectations.
Is The Bull Market Safely Over The 200-day Moving Average?
The 200-day moving average is viewed by many as the mark of a significant correction. Several weeks ago, we wrote about the changing nature of market behavior when it’s below the 200-day. Breaking below the 200-day is predictably bearish.
Likewise, recovering from being under the 200-day is predictably bullish. You do not, however, want to be too quick to claim the bearish move is over.
Since the market was able to recently close over 1% higher than the 200-day for 2 days, I looked at what history says about the SPY when it breaks the 200-day by at least 3% and then what happens after it recovers with 2 days of closing 1% above the 200-day.
For the discretionary trader with some decent trading rules like our “close and continue” tactic this recovery criteria is very effective. There are a few instances where 1% wasn’t enough to sustain rally, but it is enough for the nimble trader who adapts to a reversal back into negative territory.
It is certainly prudent to wait for markets to recover the 200-day level if you want to avoid the biggest drawdowns. Below, you’ll find the stats of the last 23 occurrences of this pattern.
Before we look at the summary, take note of the following.
The summary statistics below do show the pattern is worth paying attention to.
If you’d like a PDF book of the charts of all 24 events, members of our weekly Free Market Opportunity report newsletter will receive this on Sunday evening 4/12. You can find a link to the Opportunity Report on the home page, www.marketgauge.com.
When you look at the charts, it becomes clear that the markets that break up through the 200-day without quickly retreating tend to lead to substantial gains. The failures are also quite remarkable. So this is a very tactical trade setup. Use risk management.
The Next Obstacle For The Bulls Is Earnings Season.
Next week, the banks kick off earnings season. Expectations are high, and investors are eager to hear what management has to say about how the war is impacting their outlook.
Below you’ll find a table of major bank announcement dates next week.
The Stars Ranking is our PRIME ranking (1-5) for the technical condition of the trend in 3 different time frames. The short-term (1-5 days) is too short to be relevant for an earnings announcement, but the intermediate-term (2-8 weeks) and the long-term (2-6+ months) are readings that could be helpful.
If the earnings announcement pushes a stock with an intermediate or long-term bullish 4 or 5-star reading, that momentum could follow through. On the other hand, a weak earnings report on a stock with only 2 or three stars could send it much lower.
If you’d like to learn more about the Stars Ranking, join the Opportunity Report for free on our
Want Help Making Sure You See What’s Coming?
If you'd like access to the MarketGauge indicators, strategies, automated trading models, and more, contact us.
Best wishes for your trading,
Geoff Bysshe
Co-Founder
(Connect on LinkedIn)
 |
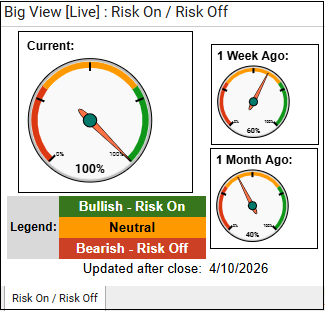 Every week we review the big picture of the market's technical condition as seen through the lens of our Big View data charts. Every week we review the big picture of the market's technical condition as seen through the lens of our Big View data charts.
The bullets provide a quick summary organized by conditions we see as being risk-on, risk-off, or neutral. The video analysis dives deeper. |
Summary: Markets staged a broad-based risk-on rally with strong gains, improving breadth, leadership from semiconductors and growth, and multiple indicators (internals, volume, risk gauges, global equities, and Bitcoin) flipping bullish—though momentum still faces resistance at declining intermediate trends.
However, conditions are now stretched to near-term overbought levels with volatility compressing and macro inputs (rates, commodities, gold) largely neutral, suggesting the rally may need consolidation before sustaining higher.
Risk On
Neutral
Bias: Lean Risk-On, but tactically managed (not fully committed yet)
Execution Framework
Risk Management / Positioning
What to Watch (Decision Triggers)
Bottom Line
Participate in the upside, but treat this as an early-stage regime shift with overbought risk—build exposure selectively, stay focused on leaders, and be quick to de-risk if momentum fails.

Every week you'll gain actionable insight with:


