April 5, 2026
Weekly Market Outlook
By Geoff Bysshe

Tactical and active investors look for “changes” that lead to new trends.
In our live mentoring, I encourage looking for “firsts” as important messages from the market.
Last week was chock full of “firsts” and “changes” that may turn “green shoots” into the next major market narrative.
A couple of important “firsts” related to the primary market narrative that the crude oil trends are driving stock prices are shown in the chart below.
In the chart tracking the weekly percent change of USO (red) and XLE (orange), along with SPY (green) and QQQ (blue), a few patterns stand out.
The break in correlations with oil made last week’s price action very different and potentially bullish. The size of the move was also impressive.
However, the biggest up week for stocks in 2026 followed the biggest down week. As a result, it didn’t trade higher than the prior week, closed at the same level as it had just 6 days earlier, and well below the 200-day MA.
Keith covers the technical condition of the market extensively in his weekly market analysis video below.
The next “first” we’ll be looking for in our trading room will be a weekly close significantly over a prior week’s high. That hasn’t happened in the SPY or QQQ in 2026. That’s a simple first sign of a durable reversal.
Did The Economic Data Break Oil’s Stranglehold on Stocks?
With the war in focus, it was easy to overlook the economic data that was remarkably optimistic if you’re focused on growth, but less so if you’re concerned about inflation.
Here are a few signs from last week’s economic data that the economy remains resilient.
ISM Purchasing Managers PMI
Readings in the ISM PMI above 50 indicate expansion. This week’s report not only posted its third reading above 50 for the first time since 2022, but additionally, each of the last 3 months has reported above consensus.
Retail Sales
The consumer is still spending. The latest read of Retail Sales was on the high side of its range over the last year, and above consensus. This is the second month in row this measure beat expectations.
This doesn’t suggest the consumer is flush, but considering the fear around the labor market, it does suggest the consumer is not retreating.
The Labor Market
Initial Jobless claims continue to be below and have come in lower than expectations for the last 7 months. People are not leaving their jobs.
JOLTS Job Openings
After sliding in November and December, the Jolts Job Openings reading picked up in Feb and March. The trend since June of 2022 remains bumpy but down.
ADP Nonfarm Employment Change
Based on ADP’s Employment Change measure, the last two months have both been better than any of the prior 6 months. Both were also higher than expected
Nonfarm Payrolls
Nonfarm payrolls have recently been extremely volatile and exceeded expectations by wide margins in both directions. The most recent value of the 3-month average (shown in red) suggests the labor market is not getting weaker.
The Unemployment Rate
The Fed closely monitors the Unemployment Rate because it is the final measure of labor market supply and demand. 3 of the last 4 months have had reading lower than the prior month.
The News Wasn’t All Rosy.
GDPNow
Despite the data above supporting the argument that the consumer and labor market are resilient, the GDPNow data suggest the economy is weakening. The downtrend in the chart below illustrates how estimates of current quarter GDP have been declining.
While the trend looks ominous, the level is not. The most recent reading dropped from 1.9% to 1.6% for the current quarter. Many economists would argue that a 2.0% to 2.5% trend in GDP growth would be healthy. We’re not far off, however…
ISM Manufacturing Prices Suggest Inflation is Igniting
ISM Manufacturing Prices have jumped higher, exceeding expectations in a bearish way (higher than expected). This broke a streak of this data point reporting lower-than-expected readings in the prior 7 months. This puts the inflation metric at the highest level since July 2022.
The War Is An Easy Distraction. Don’t Take Your Eye Off The Economy
At MarketGauge, we don’t believe you need to be an economist to figure out which way stocks will move next, but it can help to pay attention to the balance between growth and inflation right now.
In the spirit of our PRIME Method of analysis, the macro question that tactical investors should be asking is, “Does the economy have a real growth story that will lead to higher earnings?”
Nominal growth – yes, but real (inflation-adjusted) growth, we’ll see.
There are several inflation measures, like the ISM Prices above, that suggest inflation is igniting again.
Next week, we’ll get several reads on inflation, but the Fed Funds market is clearly not positioning for lower inflation.
The table below shows the probabilities of the Fed Funds rates for each meeting going forward, based on trading in the Fed Funds futures. The blue box represents the highest probability for each meeting.
As you can see, the odds don’t suggest a cut until July of 2027!
The Market Is Close To Saying – Raise Rates!
Two weeks ago, in Market Outlook, we focused on the war's impact on inflation and the bond market’s message, as expressed in the chart below.
This chart shows the relationship that led Jeffrey Gundlock, the “bond king” from DoubleLine Capital, to say…
“The Fed doesn’t need data—it has the markets.”
He was referring to his belief that the Fed Funds Rate follows the market-driven 2-year treasuries.
The chart below shows how accurate that is and supports the Fed Funds market's belief (above) that Fed Funds are unlikely to fall significantly unless something changes.
Next week, we’ll get several additional inflation measures, and the market narrative with respect to higher rates and inflation is, “guilty until proven otherwise.”
Growth stocks can adapt to moderate inflation, and multiples have been reduced by the correction and increasing EPS estimates.
However, the market’s balance between believing in growth and fearing inflation leading to higher rates could tip either way.
Earnings season could be the deciding factor.
Inflation Proof Stocks
In last week’s Market Outlook we outlined the PRIME Method of selecting stocks that we use in our Opportunity Report to identify the stocks that are capable of leading the market higher in any market condition.
This doesn’t mean finding the one stock that works in all conditions. It means tactically rotating into the stocks that are demonstrating an ability to lead the market in the current conditions based on 5 different metrics.
The PRIME framework is based on these conditions that influence a stock’s or market’s trend:
Last week, we focused on Fiber Optic stocks that took off.
GLW up +16%
CIEN up +22%
AAOI up +25%
This week’s 3 new Opportunity Report stocks are more diversified. The one we’ll highlight here is a leader in the space industry group.
Satellogic Inc.(SATL) builds and operates nano satellites for commercial-grade Earth observation in real-time. It offers data streams for decision-making across government, organizations, businesses, and individuals.
SATL isn’t yet profitable, but it’s 5 year CAGR in sales growth is 42%. Plus, the war in Iran and other geopolitical conflicts make their products extremely timely and the PRIME technical indicators suggest the market agrees.
In the chart below, you can see that all 4 indicators, Real Motion momentum in two time frames, Triple Play Leadership, and Triple Play Volume, all turned bullish in early January. At the same time, the price broke out of a month of consolidation and quickly doubled from $2.50 to over $5.
After retracing back to the 200 DMA around $3, the indicators repeated the pattern of all lining up in bullish trends as the price broke back above the 50 DMA and the stock doubled to over $6.
The stock has now retraced to the 10 DMA and resumed its trend higher.
The current new high close should continue higher without trading below the $4.50 level under the recent swing low.
An initial target could be the $9.50 area, just below the $10 level at which SATL went public as a SPAC offering in late 2021.
The space industry has several exciting companies whose stocks are in trends worth following. The upcoming SpaceX IPO is likely to create volatility both up and down, creating additional trading opportunities this year.
These stocks include RKLB, ATS, IRDM, VSAT, PL, BKSY, SID U, RDW, FLY, MDA.
We’re looking forward to more exciting trades from this industry group in 2026.
Want Help Making Sure You See What’s Coming?
If you'd like access to the MarketGauge indicators, strategies, automated trading models, and more, contact us.
Best wishes for your trading,
Geoff Bysshe
Co-Founder
(Connect on LinkedIn)
 |
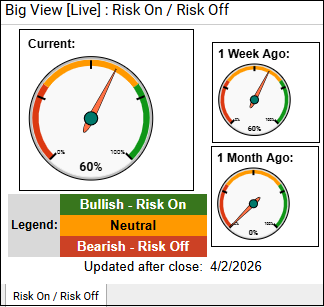 Every week we review the big picture of the market's technical condition as seen through the lens of our Big View data charts. Every week we review the big picture of the market's technical condition as seen through the lens of our Big View data charts.
The bullets provide a quick summary organized by conditions we see as being risk-on, risk-off, or neutral. The video analysis dives deeper. |
Summary: Markets staged a broad rebound with improving internals, resilient “modern family” leadership, and favorable seasonality, but the move remains tentative with key indexes still below long-term trends and volatility elevated. Underneath, risk signals remain mixed with weak breadth, negative longer-term trends, and surging oil suggest the broader downtrend isn’t resolved despite the short-term bounce.
Risk On
Neutral
Risk Off
1) Positioning (Stay Tactical, Not Committed)
2) Where to Lean Long (Selective Strength)
3) What to Avoid or Fade
4) Risk Management (Critical Here)
5) Confirmation Triggers (Add vs Reduce Risk)

Every week you'll gain actionable insight with:


