September 2, 2013
Weekly Market Outlook
By Mish Schneider
Over the last three weeks this column has suggested that…
First, in early August, the high level of new 52-week lows was an ominous sign, and a continuation of the uptrend in the VIX would confirm that future weakness should be taken seriously.
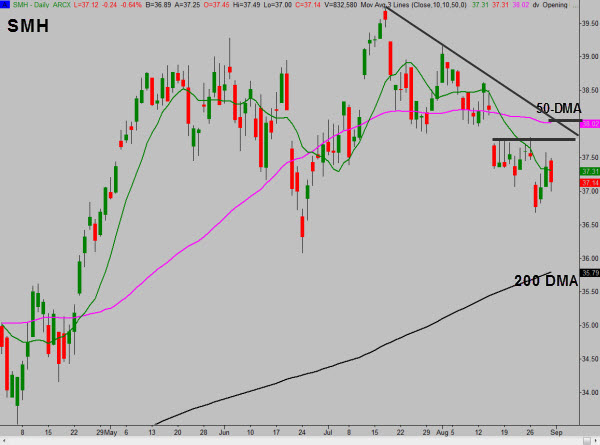
Second, the SMH was unusually weak relative to the Q’s and further weakness would indicate that the Q’s would not be able to maintain its position as the only index holding above its 50 DMA if the SMH broke down.
Third, that the carry trade as represented by the DBV, and the relationship between GLD and SPY were both suggesting that that the current correction had more downside even if a short bounce temporarily buoyed the hopes of the bulls.
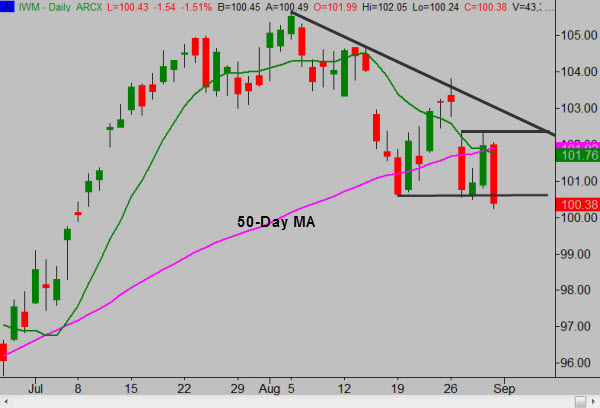
And finally that the swing lows in the IWM around the 100.60 level should serve as a good line in the sand for the bulls.
Due to our travel schedules we can’t produce a video this week, but here are the charts we’ve been focused on for weeks. The message is the same - weakness is dangerous, not a buying opportunity yet!
Here’s what to watch.
As you can see in chart #1, the SHM has not recovered from its gap down under their 50-DMA. Until the SMH’s break and close over the $37.75 resistance the QQQ’s are likely to remain under pressure. Further confirmation of the end of its correction would include breaking the trendline from the high and trading back over the 50 DMA.
Chart 1: SMH daily
As you can see in chart #2 the GLD / S&P 500 ratio is now pointed in a the direction that indicates that GLD will outperform SPY over the coming weeks if not months. When this weekly ratio gains enough momentum to cross its 20-week moving average, the SPY’s tend to remain strong (or in this case - weak) for weeks to months.
Chart 2: GLD / S&P 500 Ratio
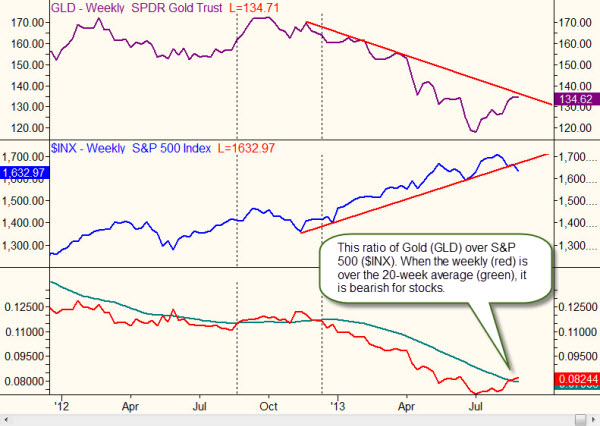
Chart #3 shows how the carry trade, represented by DBV. This was explained in last week’s video. Stocks tend to trade in the same direction as the DBV so the unusually large divergence is a big negative for stocks if the DBV continues lower. Last week the DBV continued its sharp move lower.
Chart 3: DBV - The Carry Trade
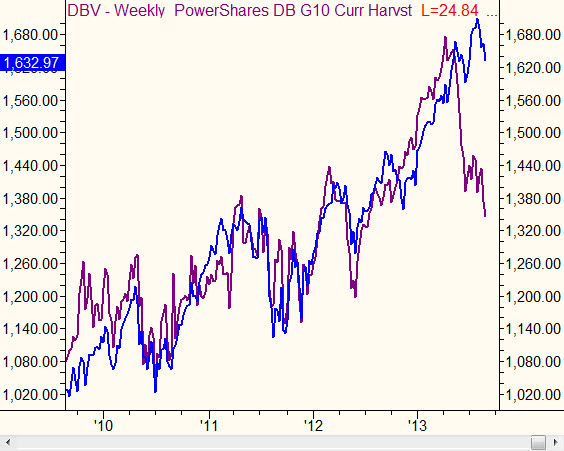
Chart #4 may be the most important chart to watch as there is no better indicator than price. The bearish zone to watch is below the swing low indicated by the lower black line. Above that line is a neutral zone, and should IWM get back over the top horizontal line (last Tuesday’s high), then we could consider the prospects of a resumption of the bullish long term trend.
Chart 4: IWM Daily
In conclusion, and as I’ve been saying for weeks, there are quite a few reasons to believe this correction will not be brief and therefore weakness should not be viewed as the bottom. This is still true. Now four weeks from the top, however, we should be on the lookout for a flush of bearish activity. If the market experiences a sharp drop on massive volume followed by a reversal pattern on volume then we can start considering the idea that the correction is over.

Every week you'll gain actionable insight with: