November 6, 2025
Mish's Daily
By Mish Schneider
"Intermediate and secular strength, with short-term caution — a bullish phase under pressure."
I started to write about the Retail sector through the eyes of our Granny Retail and the ETF XRT for some time now.
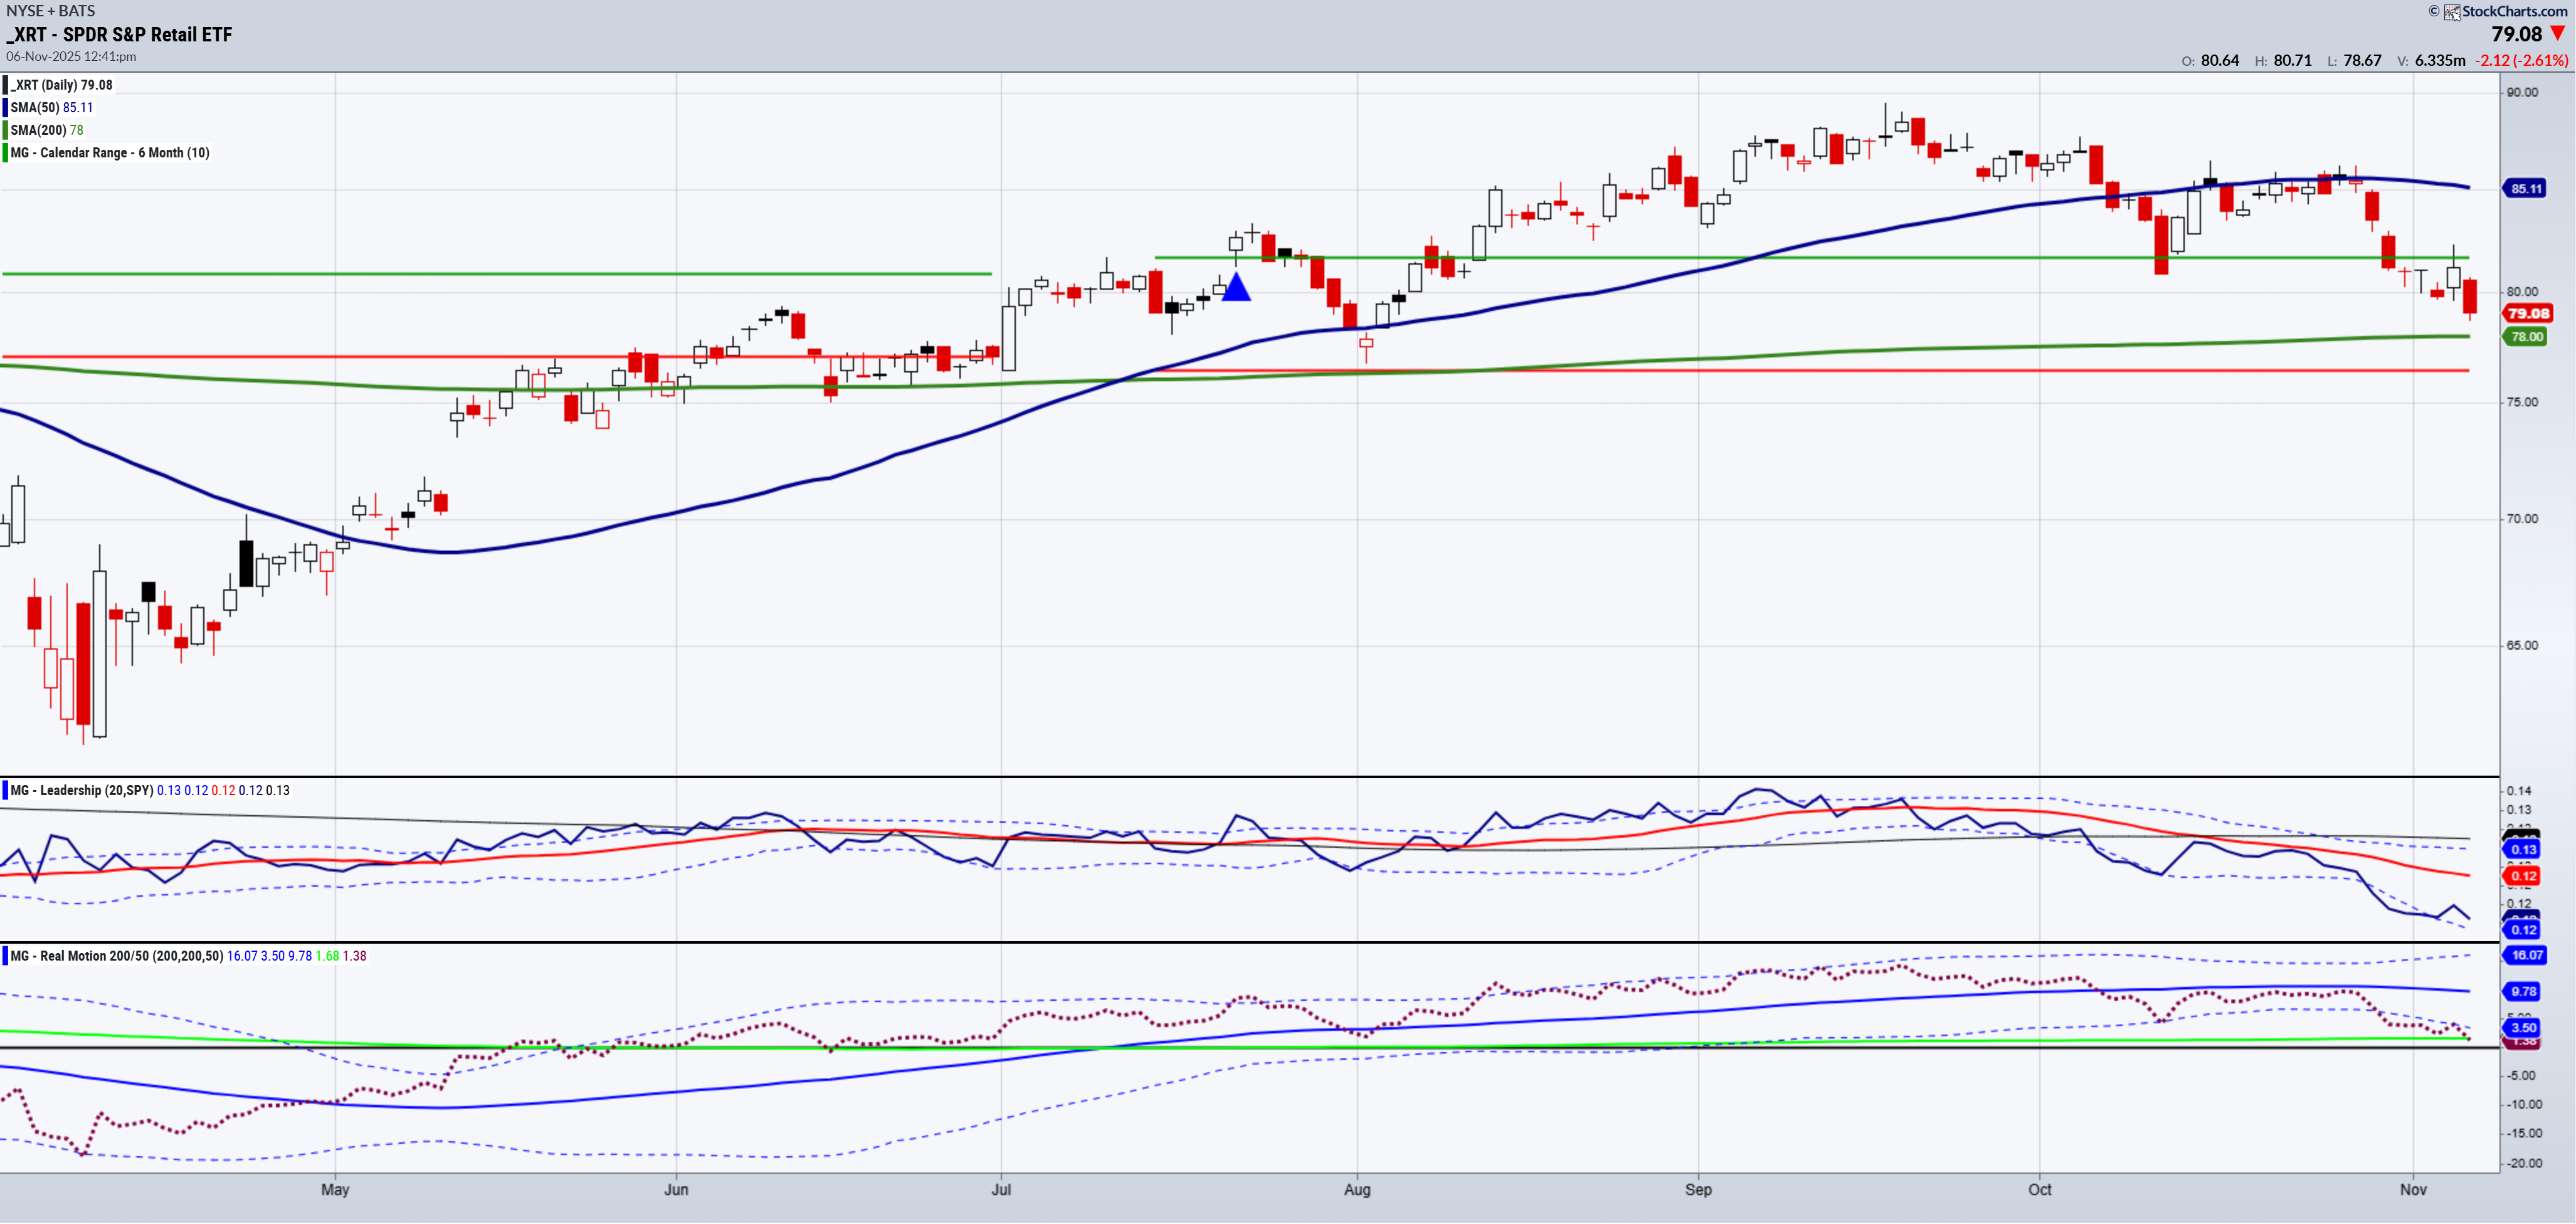
On the Daily chart, XRT broke down under the 50 DMA (blue) early October.
Here we are one month later, and despite QQQs and SPY having made new all-time highs mid-October, our Granny could not clear back over the 50-DMA.
We call that a warning or caution phase to be taken seriously.
Especially when it is our dear Granny, which represents the consumer or 70% of the gross domestic product.
Now, XRT comes close to testing the 200-DMA (green.)
So, the bigger question is, what now?
This is where multiple timeframes help you step back and gain a more macro perspective.

On the weekly chart, the good news is that XRT remains above the 50-week moving average.
This could suggest that the correction is just about over.
However, I will continue to watch the Daily timeframe as bulls do not want to see the price break below that 200-DMA.
Momentum or the Real Motion indicator shows support at its 200-DMA (also green).
A break of price and momentum would be a case for even more caution.
A pop in price from these lows would be more encouraging.
Another interesting timeframe is the monthly chart.
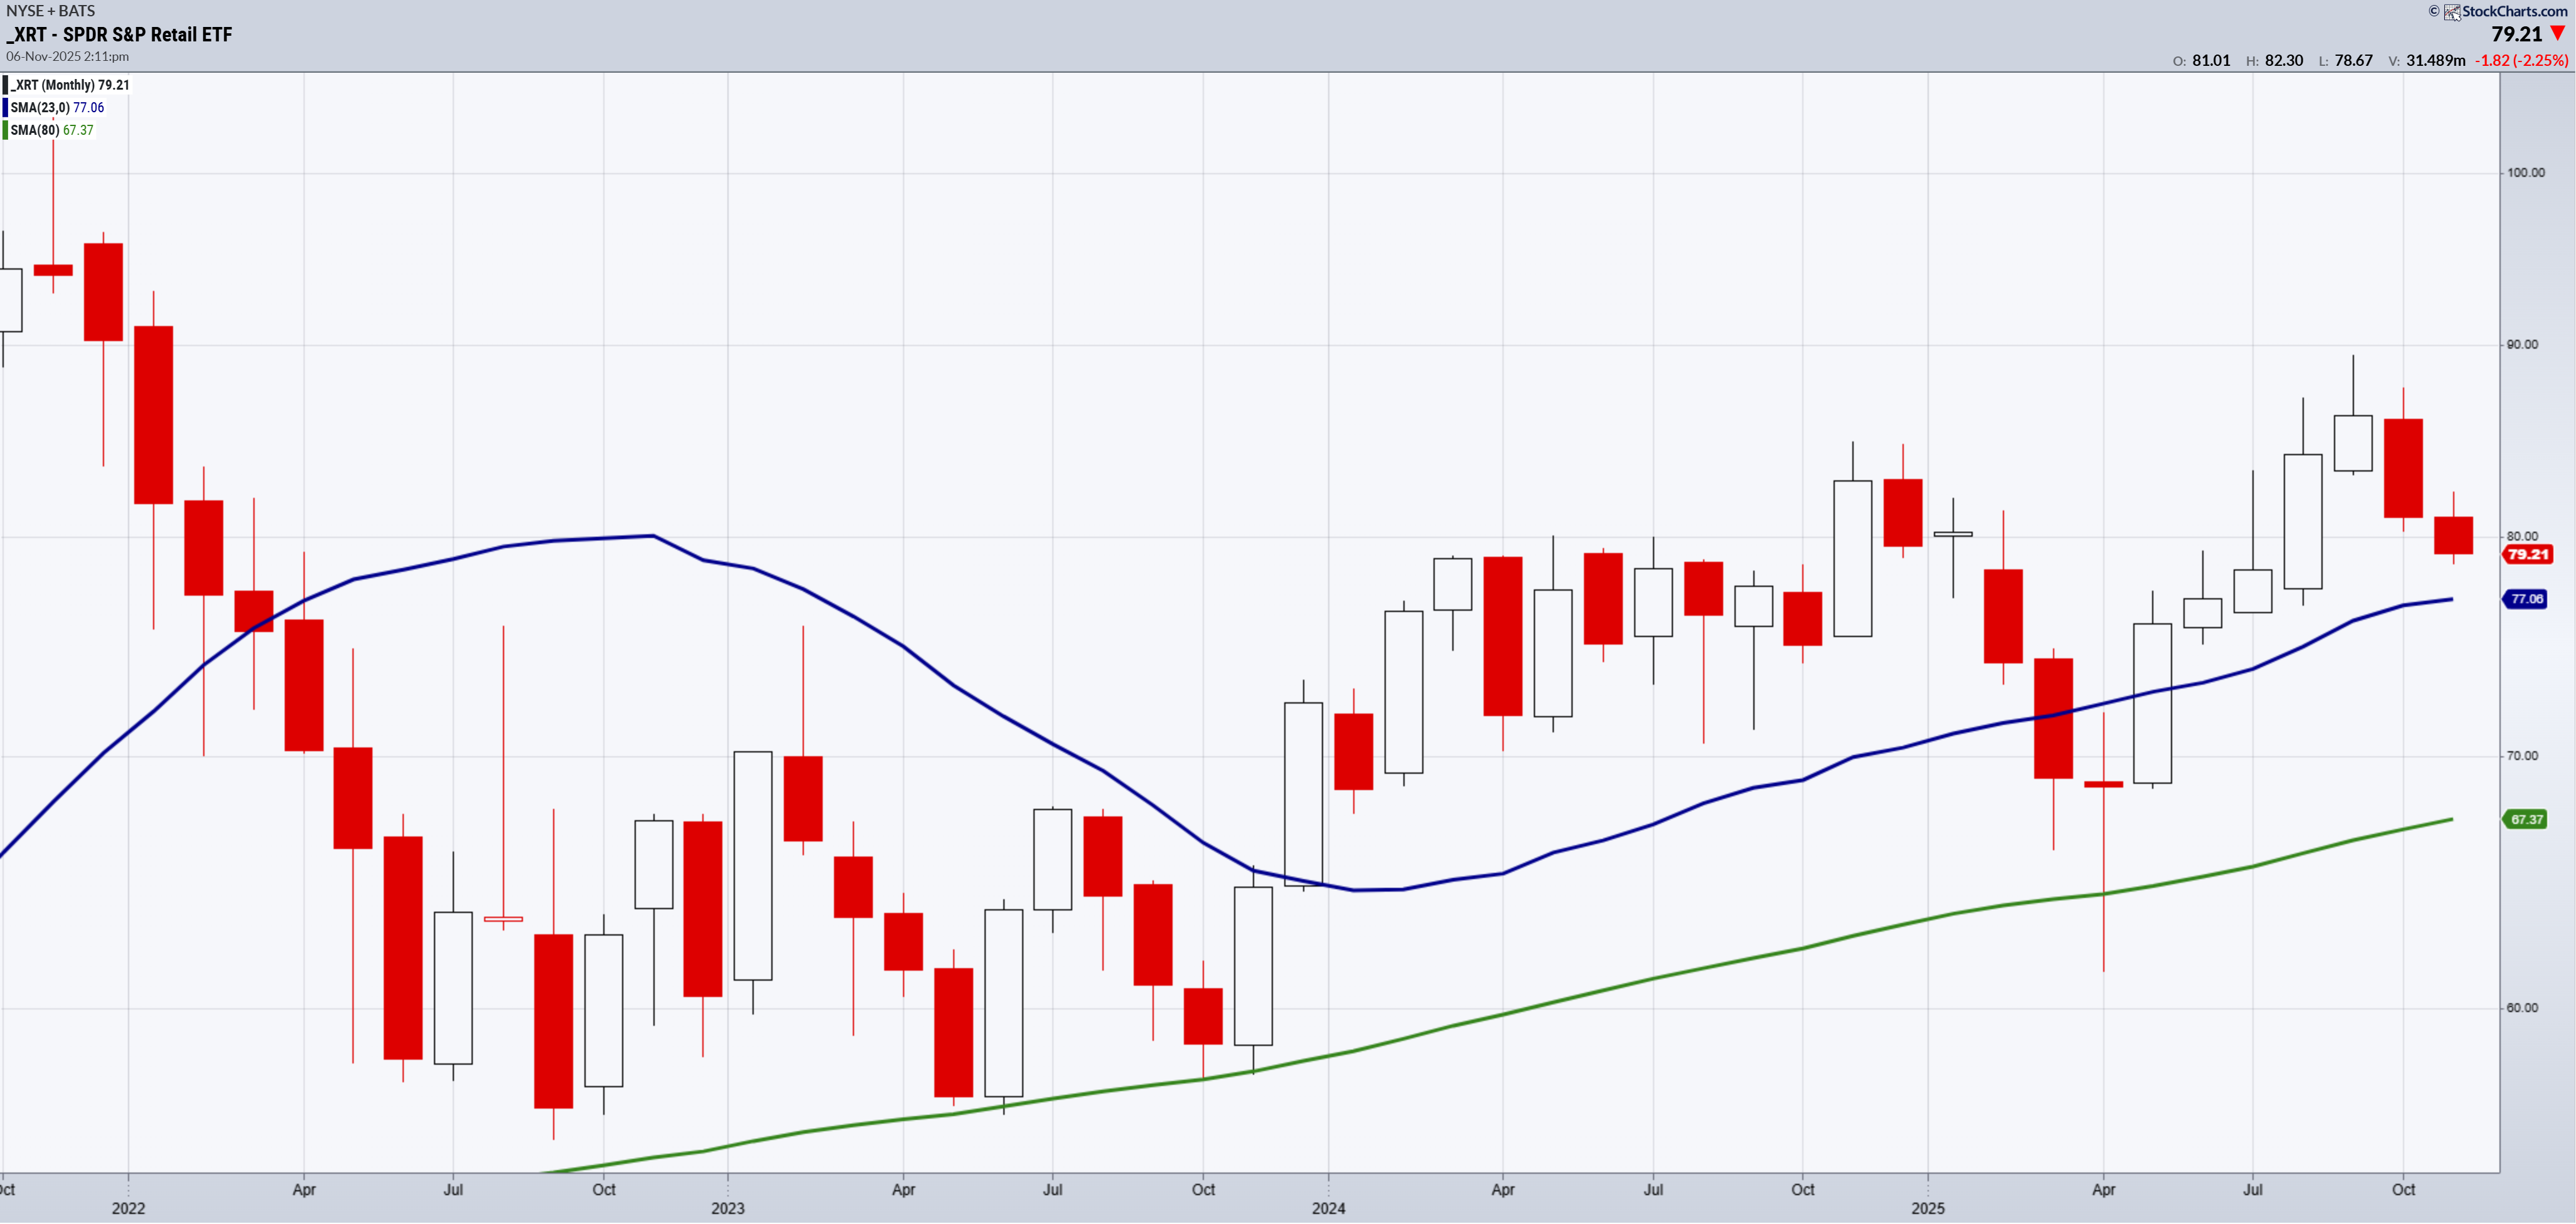
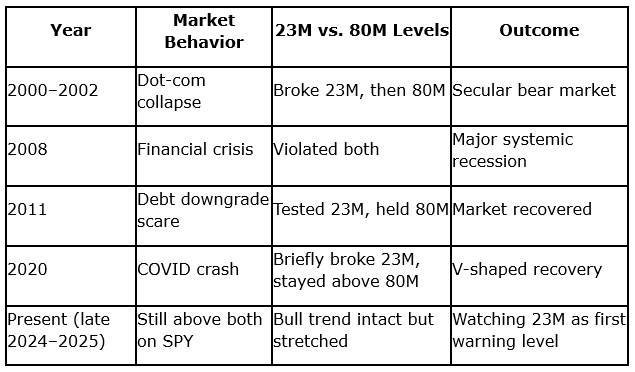
These two long-term moving averages—23-month (blue) and 80-month (green)—are essential components of MarketGauge’s technical analysis framework to identify major market regimes and long-term trend risk.
Trend Strength & Confirmation
Historical Examples
Looking at XRT right now, the price is above the 23-month moving average.
Hence, retail remains in a bull trend.
Conclusion
Buyers still control the bigger picture, but sellers (or profit-taking) are pressuring the short-term.
This is often a "buy-the-dip in a long-term uptrend" environment, as long as the ETF holds above its weekly/monthly support.
If it reclaims the 50-DMA, momentum can resume higher.
If it loses both the 50-week and 23-month MAs—that’s when a real trend change risk emerges.
For more detailed trading information about our blended models, tools, and trader education courses, contact Rob Quinn, our Chief Strategy Consultant, to learn more.
-----Get your copy of
Plant Your Money Tree: A Guide to Growing Your Wealth
Grow Your Wealth Today and Plant Your Money Tree!

"I grew my money tree and so can you!"- Mish Schneider
Mish in the Media-Want to see more? All clips here
CNBC Squawk Box 11-03-25 Is AI Capex Sustainable?
Pre-Market Prep 10-31-25 Warnings in the Market
*AAII FULL WEBINAR-A Gift How to Harvest the Best Investments
Business First AM 10-31-25 Tricks and Treats And one pick
NYSE TV 10-22-25 Earnings Bonds and Metals
Coming Up:
November 11 Crypto Spaces
November 12 Maggie Lake
November 13 Real Vision
November 14 Financial Sense
November 19 CNA Asia
December 1-3 The Sarasota Money Show

ETF Summary
(Pivotal means short-term bullish above that level and bearish below)
S&P 500 (SPY) 677 now resistance and 664 support
Russell 2000 (IWM) Under the 50-DMA and now an unconfirmed caution phase
Dow (DIA) 463 key support
Nasdaq (QQQ) Possible move down to 600 support
Regional banks (KRE) Now under the 200-DMA
Semiconductors (SMH) 350 support
Transportation (IYT) So key as this dances around the 50-DMA
Biotechnology (IBB) 154 support
Retail (XRT) After 21 days under the 50-DMA, next support is the 200-DMA at 78.00
Bitcoin (BTCUSD) 100,000 pivotal with 85k next support and need to see this climb back over 105k

Every day you'll be prepared to trade with:


