August 22, 2021
Mish's Daily
By Mish Schneider
Written by Forrest Crist-Ruiz
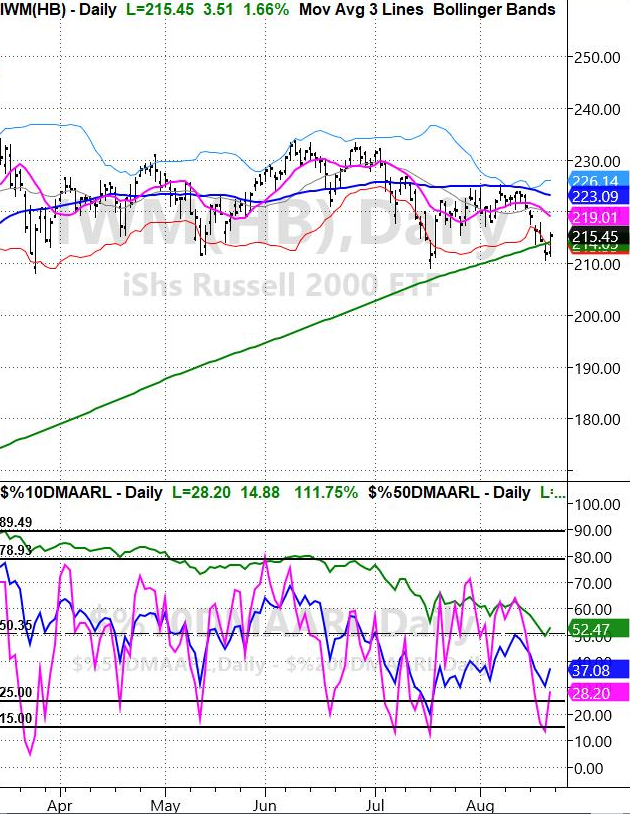
Above is a chart of the Russell 2000 (IWM). It is one of the most valuable indices as it tracks 2000 small-cap companies and therefore gives a great picture of the overall market direction.
Since the beginning of 2021 IWM has been mostly rangebound. The high of the range is around $234, while the low or the range is in the $209 area.
Thursday, IWM visited the bottom area of that range and now on Friday we are seeing IWM clear back over its 200-Day moving average at $214.
However, the key is that IWM is bouncing off the bottom of its range and is offering opportunities for traders to enter at a lower price with good risk based off the recent low.
With that said, on the above chart sits a special indicator that helps confirm the markets rally from an oversold state, but also gives caution for the coming trading weeks.
What the indicator is showing us is the percentage of stocks over 3 major moving averages.
Each colored line represents popular daily moving averages.
Green = 200-DMA
Blue = 50-DMA
Magenta = 10-DMA
Because the Magenta line is showing 28.20 that means that 28.20% of stocks in the IWM index are trading over their 10-DMA.
Likewise, 37% of stocks are trading over the 50-DMA.
Knowing this, in the past we can see that when the 10-DMA was trading under 25% along with IWM’s price trading near the bottom of its range, the market bounced back.
However, here is the catch.
Most of the time the 50-DMA and the 200-DMA were showing extra strength while the 10-DMA was dipping lower.
Currently, both major moving averages are in sharp downward curves.
This may be a sign of underling weakness in the market.
While the bounce could continue higher, we should be cautious as it might not be as strong when both the 50-DMA and 200-DMA on the indicator are sloping down.
+++++++++++++++++++++++++++++++++++++++++++++++
Follow Mish on Twitter @marketminute for stock picks and more!
Follow Mish on Instagram (mishschneider) for daily morning videos!
Wood Versus Burry Portfolios. Mish compares the portfolios of Cathie Wood and Michael Burry. Breaking down the holdings and strategies of each to decide who the winner will be.


S&P 500 (SPY) Flirting with the 10-DMA at 443.29
Russell 2000 (IWM) Closed over the 200-DMA at 214.05.
Dow (DIA) Support level 347.
Nasdaq (QQQ) 360 new support.
KRE (Regional Banks) Needs to clear the 50-DMA at 64.50
SMH (Semiconductors) 249.35 new support.
IYT (Transportation) 248.88 needs to hold.
IBB (Biotechnology) 164.27 support.
XRT (Retail) 95.37 resistance.
Junk Bonds (JNK) 108.60 support.
IYR (Real Estate) 108 resistance. Support from the 50-DMA at 105.02.
XLP (Consumer Staples) 73.25 high to clear.
GLD (Gold Trust) 168.20 gap to fill.
SLV (Silver) 21.32 support area.
XME (S&P Metals and Mining) 41.05 support.
USO (US Oil Fund) Needs to find support.
TLT (iShares 20+ Year Treasuries) Doji day.
USD (Dollar) 93.19 now support level.
DBA (Agriculture) 19.36 resistance. 18.55 support.

Every day you'll be prepared to trade with:


