November 11, 2025
Mish's Daily
By Mish Schneider
After a decent correction from the all-time highs in gold and silver, last week was the reentry point.
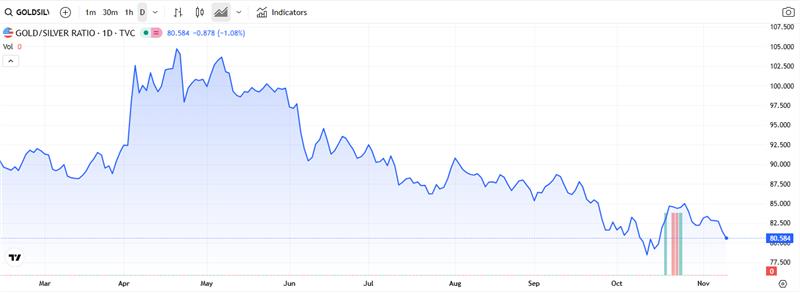
We tracked the gold to silver ratio for clues.
At the end of October, the ratio ran back up to 85.
Looking at September, that was a support and then a resistance area when the ratio dropped from under 85 to around 78.
That alerted us to think that with the rally in the ratio and the selloff in the metals, should the ratio roll over from there, it was time to consider buying silver.
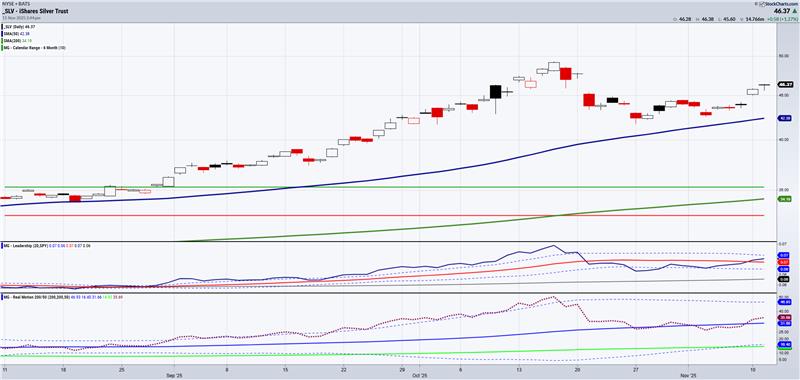
The SLV ETF, (closely tracking the silver futures) never broke the 50 daily moving average at the same time the ratio rolled over.
Note, the lower the ratio, the more it favors silver over gold.
Also note the Leadership indicator. Silver is beginning to outperform the SPY.
Momentum through Real Motion cleared the 50-DMA.
However, we need to see a lot more momentum before getting excited about new all-time highs on the horizon.
Plus, on the fundamentals, nothing has changed.
A persistent supply deficit,
Surging industrial demand (especially from green technologies),
Its status as an undervalued safe-haven asset relative to gold,
And a supportive macroeconomic environment.
We have one reason to think the metals rally can stop dead in its tracks despite this move and the reasons to be bullish.
Gold.
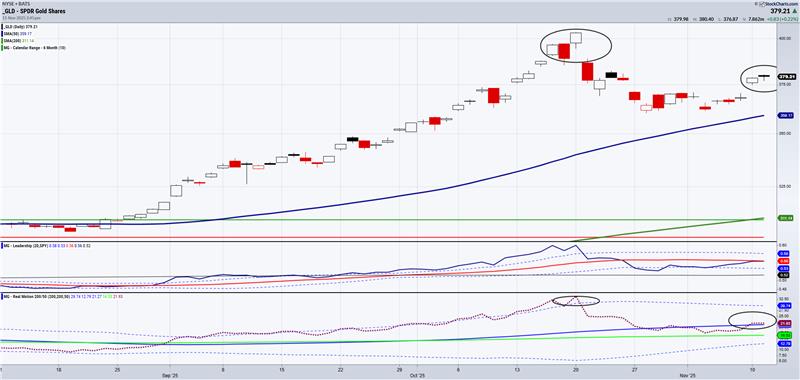
The first 2 ellipses from mid-October illustrate how strong outperformance, great momentum and new highs must line up.
As soon as the gap lower from the all-time highs happened the next day, see how the momentum (red dots) broke the dotted line of the Bollinger Band.
That is when we exited our long positions.
Fast forward to the next ellipses.
First off, SPY is on par with gold on performance. That is neutral for gold unless that changes.
Secondly, while the price is climbing, the momentum is quite far from the highs made in October.
Should GLD begin to decline, performance favor SPY and/or the momentum drop below the 50-DMA (red dots under blue), that could impact the rally.
Silver could still do better of course.
However, going back to the ratio.
A break under 78 gold to silver ratio, as we saw almost happen in October, would get us very bullish silver and we would see gold rise as well.
For more detailed trading information about our blended models, tools, and trader education courses, contact Rob Quinn, our Chief Strategy Consultant, to learn more.
-----Get your copy of
Plant Your Money Tree: A Guide to Growing Your Wealth
Grow Your Wealth Today and Plant Your Money Tree!

"I grew my money tree and so can you!"- Mish Schneider
Mish in the Media-Want to see more? All clips here
Business First AM Why the Gold to Silver Ratio is a Key Indicator 11-10-25
Business First AM Mish talks macro with some TA thrown in 11-05-25
*AAII FULL WEBINAR-A Gift How to Harvest the Best Investments
Coming Up:
November 12 Maggie Lake
November 13 Real Vision
November 14 Financial Sense
November 19 CNA Asia
December 1-3 The Sarasota Money Show

ETF Summary
(Pivotal means short-term bullish above that level and bearish below)
S&P 500 (SPY) 690 now resistance and 667 support
Russell 2000 (IWM) Retook the 50-DMA and has to hold there
Dow (DIA) 474 key support
Nasdaq (QQQ) 603 support
Regional banks (KRE) Decent comeback for our Prodigal Son-60 key support
Semiconductors (SMH) 343 support
Transportation (IYT) Looks better-still key
Biotechnology (IBB) 160 support
Retail (XRT) After 23 days under the 50-DMA, support is the 200-DMA at 78.00 and has to clear 85
Bitcoin (BTCUSD) 100,000 pivotal with 98k next support and need to see this climb back over 106exk

Every day you'll be prepared to trade with:


