October 10, 2011
Mish's Daily
By Mish Schneider
A US bank holiday typically results in low volume. The return of the Asian Market and some good news coming from Europe certainly helped a lot. But what about price, phase and slope? Price-The high of the September rally is in reach with some of the indexes bordering on overbought. Phase-All but the midcaps are in a recovery phase-QQQ cleared and confirmed last week. Slope-all declined further on the 50 DMA. That keeps the bullish jubilation tempered.
SPY: 117.00 support, 117.80 the 50 DMA and overhead resistance at the September high 123.50.
DIA: Cleared the 80 monthly and the 50 DMA at 112.10. 117.03 September high.
QQQ: 56.23 the 200 DMA resistance, 57.35 September high and 54.44 support to hold.
IWM: Today's action negated the Bearish engulfing pattern from Friday. Still has the 80 month MA to contend with at 68.55. September high 73.89. 65.60 ultimate support to hold.
ETFs:
GLD Broke above the 8 day range on light volume. If 162 holds up, measured move to 170.
SLV Inside day and narrow range which makes this still somewhat vulnerable under 30.00.
XLK (Technology) Got very close to but could not clear the top of recent range 25.29.Could drop to 24.00 and maintain its current recovery phase. Hard to get too friendly now with RSI approaching overbought territory.
SMH (Semiconductors) 29.74 the high in September and is now officially overbought on a short term RSI indicator. That makes 29.00 pivotal with a correction to 27.85 possible.
IBB (Biotechnology) September high 99.54. Not overbought like the techs.
XLE (Energy) If 62.00 holds, 65 next target.
OIH Under 112.50 still vulnerable. So far from September high-fairer target if holds at 124.75.
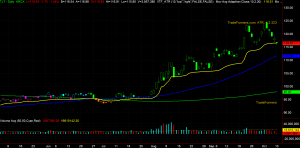
 TLT ** (The 20 year Treasuries) 5 down days and impressively held the adaptive moving average 116.50. Now that it is getting oversold, can see a move up to 119.40 fairly quickly.
XLF (Financial) 12.00 support, 12.62 next resistance
XRT (Retail) 50.05 the resistance at the 200 DMA.
For more detailed analysis join me, along with hundreds of other subscribers, at Mish's Market Minute and get my daily trade picks, trade alerts, training videos, and exclusive analysis tools. Sign up for Mish's Market Minute now and get a free 2 week trial!

Every day you'll be prepared to trade with: