October 10, 2022
Mish's Daily
By Mish Schneider
Written by Mish Schneider and Wade Dawson
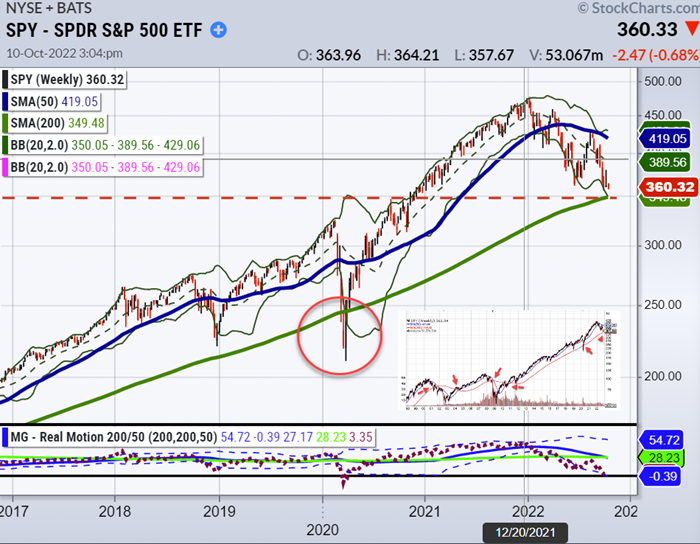
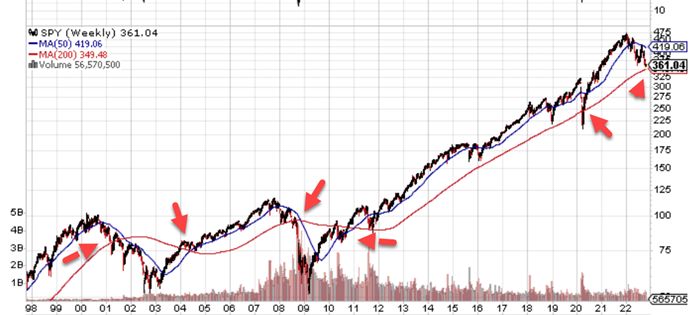
The S&P 500, represented by the SPY, has generally stayed above the 200-week moving average long-term. It is a good line in the sand to use as a guide for potential market crashes.
Bear market declines are primarily responsible for the few occasions when the SPY dipped to or below the 200-WMA — most notably in 2001, 2009, and 2020.
Due to the devaluation of US debt, the SPY also temporarily breached the 200-WMA in 2011.
The adage "Don't fight the Fed" was repeated by Mish recently to remind our team that the Fed is aggressively tightening into a slowing economy with high inflation and a tight labor market.
The stock market is on a collision course, but based on past seasonal trends since 1946, we might not want to "Fight the mid-term elections."
The seasonal pattern of stock prices during mid-term election years points to an anticipated pattern.
What will the SPY's 200-week moving average tell us about the likelihood of more market falls and the plausibility of the normal mid-term election stock market pattern materializing in the coming weeks?
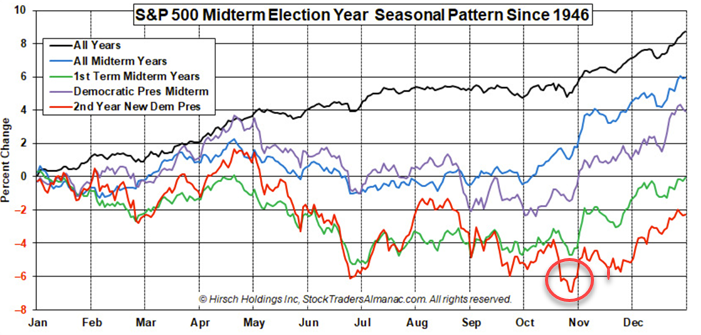
During mid-term election years since 1946, there is bias to the downside from mid-October to early November, but a strong rebound is generally seen.
The chart above, "S&P 500 Midterm Election Year Seasonal Pattern Since 1946," points to lower stock prices in mid to late October, with a rebound in November lasting through the end of the year.
Please note the red line above represents the 2nd Year of a New Democrat elected President.
-
Historical seasonal patterns since 1946 around mid-term elections point in a particular direction, but that does not mean this year will follow the past seasonal direction.
With the market in such a bearish mode, it may be hard to have confidence in this bullish seasonal pattern established since 1946.
Will this year deviate from the mid-term election seasonal pattern?
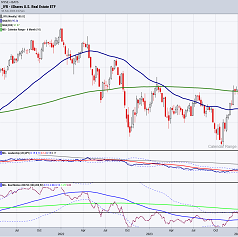
For specific confirmation and signaling, we will look at the 200-weekly moving average in the SPY, XRT, IYT, and IWM and keep our subscribers closely informed.
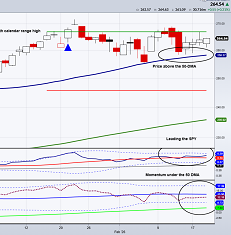
The SPY and Mish's Economic Modern Family could signal an increased sell-off in the upcoming days and equally alert us to a potential seasonal trend change in the weeks ahead, which could lead to a profitable 4th quarter for those prepared.
-
SPY - SPDR S&P 500 Trust ETF (1998-2022)
The 200-week moving average history
Subscribe to Mish's Daily for additional market insights and stay up to date on the Modern Economic Family's next market moves. You don't want to be caught in a market crash – or miss out on potential profits.
You can also sign up for a free consultation with Rob Quinn, our Chief Strategy Consultant, by clicking here to learn more about Mish's top-rated risk management trading service.
-
Mish's Upcoming Seminars
The Money Show, October 30 – November 1
Join Mish and many wonderful speakers at the Money Show in Orlando beginning October 30th running thru November 1st. Spend Halloween with us! Use either link to join Mish there!
Trader's Summit, October 21-23
Mish speaks with Helene Meisler on October 23rd at 12 ET.
Trader's Summit

Get your copy of
Plant Your Money Tree: A Guide to Growing Your Wealth
Grow Your Wealth Today and Plant Your Money Tree!

"I grew my money tree and so can you!"- Mish Schneider
Mish in the Media
CMC Markets 10-05-22
Are we due another supercycle in miners and precious metals?
BNN Bloomberg-Unraveling? 09-30-22
ETF Summary
S&P 500 (SPY) 358 support and 365 resistance
Please note previous first level of support listed on Friday, October 7, 2022, was 371 and Friday's high was 373 before closing at 362.79.
High of the SPY on Monday was 363.96 and the low was 360.44
Russell 2000 (IWM) 166 support and 171 resistance
Dow (DIA) 290 support and 296 resistance
Nasdaq (QQQ) 263 support and 269 resistance
266 support and 272 resistance were the past trading levels and sold off on Monday near support at 266.41.
KRE (Regional Banks) 59.22 is support and 61.70 resistance
We had listed support at 60.30 for Friday and sold off to 60.34 on Friday's close and closed on Monday at 60.21
SMH (Semiconductors) 180 support and 185 resistance
IYT (Transportation) 196 support and 203 resistance
IBB (Biotechnology) 116.59 is now support and 120 resistance
We had listed support at 119.32 on Friday and sold off to 118.84 on Friday's close right around first level of support and closed at 117.95 on Monday.
XRT (Retail) 57 is now support and 60 is resistance
We had listed support at 58.38 and sold off to 58.26 on Friday around first level of support. XRT closed at 57.99 on Monday.

Every day you'll be prepared to trade with: