November 7, 2022
Mish's Daily
By Mish Schneider
Written by Wade Dawson and Michele Schneider

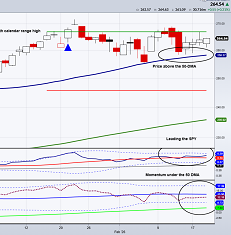
The Dow Jones Industrial Average (DJIA) had a good day and broke over the 200-day moving average.
It is essential to be selective and understand what is driving the market up. Cyclical stocks, many in the DJIA, benefit from continued inflationary pressure.
While all indices are down, the DIA has been less volatile and potentially better investment for the remainder of the year.
DIA is down -10% year to date, with IWM -20% and SPY both down -20% year to date, and the QQQs are down -33%.
Investors looking to position their trading ahead of rising prices should embrace value and cyclical stocks.
Energy and base metals stocks indicate we are in for sustained inflation. This means that traders need to position trades for more price increases.
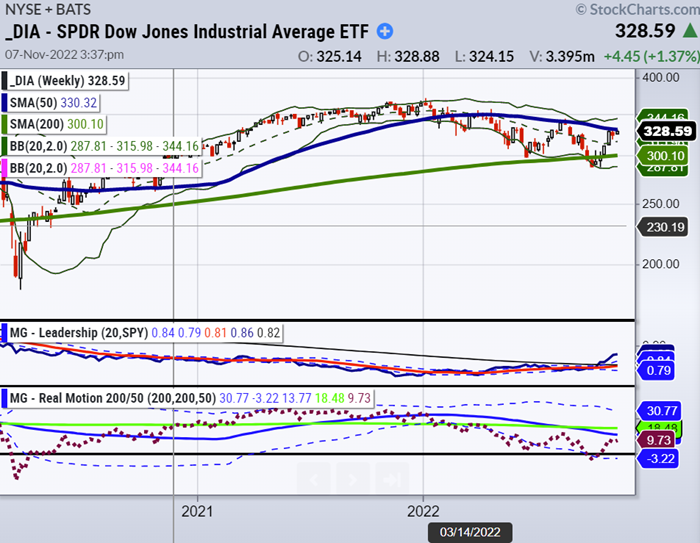
The DJIA is the oldest barometer of stock market activity and has many cyclical stocks in the index.
Note on the weekly chart that DIA must clear the 50-week moving average.
Although the chart looks promising, it is essential to see these pivotal resistance areas clearly and track performance.
The fourth quarter is often a time when the market begins to show opportunities for those who are patient.
For example, cyclical stocks like Caterpillar Inc. (CAT) and others benefit from continued inflationary pressure.
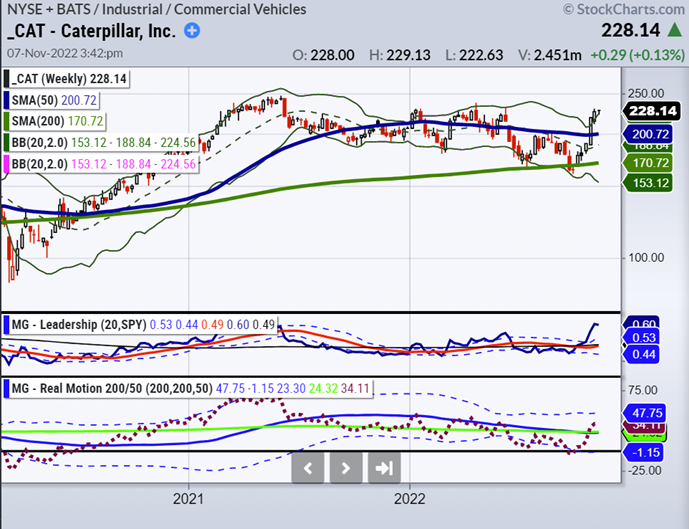
Caterpillar gapped higher and has not looked back. However, note that momentum is leveling out, and there is resistance at the April high.
Interesting week, interesting charts.
And to add to the mystery, the blood moon and last lunar eclipse of 2022 will occur just a few early hours before the mid-terms.
Contact us today if you want more information on how we can help you position your trading to withstand elevated inflation.
You can sign up for a consultation with Rob Quinn, our Chief Strategy Consultant, to learn more about Mish's Premium trading service.
Get your copy of
Plant Your Money Tree: A Guide to Growing Your Wealth
Grow Your Wealth Today and Plant Your Money Tree!

"I grew my money tree and so can you!"- Mish Schneider
Mish in the Media
UBS Trending 11-04-22
Inflation and Fed Outlook 2023
Charles Payne 11-04-22
Fox Business, Oil Markets Roil Fed
Cheddar News 11-03-22
Fed Hawks Turn Markets Blue
Cavuto Coast to Coast 11-03-22
Fox Business, The Fed's Dilemma
Traders Summit, Online Conference 10-23-22
Live Panel with Michele “Mish” Schneider & Helene Meisler
BNN Bloomberg 10-27-22
The New Paradigm - Small Caps Over Tech Stocks
ETF Summary
S&P 500 (SPY) 375 support and 383 resistance
Russell 2000 (IWM) 177 support and 183 resistance
Dow (DIA) 325 support and 330 resistance
Nasdaq (QQQ) 264 support and 270 resistance
KRE (Regional Banks) 62 support and 65 resistance; same as before
SMH (Semiconductors) 190 support and 198 resistance
IYT (Transportation) 212 support and 216 resistance
IBB (Biotechnology) 127 support and 132 first resistance; same as before
XRT (Retail) 58 support and 63 resistance; same as before

Every day you'll be prepared to trade with: