September 5, 2016
Mish's Daily
By Geoff Bysshe
 Due to the holiday weekend the Weekly Market Outlook will not have a video, and the commentary has been shared as the Mish Daily commentary as well.
As we say good-bye to the summer trading season there are two things that should be on the top of our minds as traders.
Rather than dissect the employment data, let’s focus on what really matters when the data is reported – how the market reacts to it.
As you can see by our sector summary chart below (also available daily here) the whole market liked the report. All but one sector was up on the day.
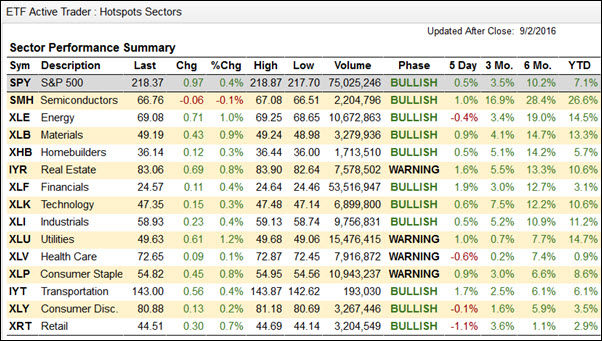
The one sector, Semiconductors (SMH) that ended the day in the red on Friday did so by such a small margin that it’s hardly fair to call it a loser.
More importantly the SMH is the strongest sector in the 3-month time frame by a factor of 2 vs. the second strongest sector (XLK), and a factor of 3 vs. the next closest competitor!
So it makes sense that a market in a good mood would favor the laggards over the standout leader, and…
It’s still fair to say that every sector liked the report.
However…The most important day for reading the mood of the market is not the day big news comes out.
It’s the morning after.
The first reaction is important and certainly can be traded, but if Tuesday’s action reverses Friday’s up day, then the bulls should beware. In the context of a strong bull trend, however, beware means look for the pull back to buy (just not too soon).
And that brings us to the importance of September, which historically has been reliable at bringing market pull backs.
The common analysis of historical performance by month of the year paints September as a very dangerous one for the bulls.
For example, Yardini Research Inc. (which is one of the most highly rated firms by Institutional Investor) has a very good report about monthly returns which I’ve shared in part and I’ve summarized below and you can find a link to at the bottom of this page.
In this report you will find that since 1928 September has had the following qualities:
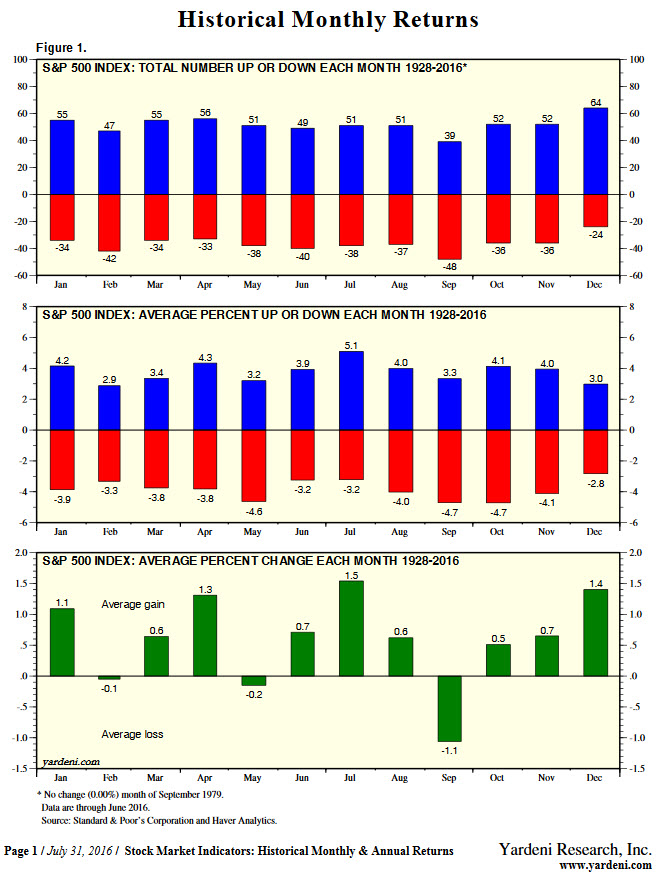
** If you’d like the data that created these Yardini charts you can find a link to it at the end of this post
However, with all due respect to Ed Yardeni and company, I don’t think these statistics include enough context!
In past posts I’ve argued for the consideration of more context before submitting to the conclusions of any statistics you read.
So once again, here’s the rest of the story…
If you look at the S&P 500 cash index since 1967 and you consider what the market has done for the year (YTD) leading up to September, and how the market performed in August you’ll find the following:
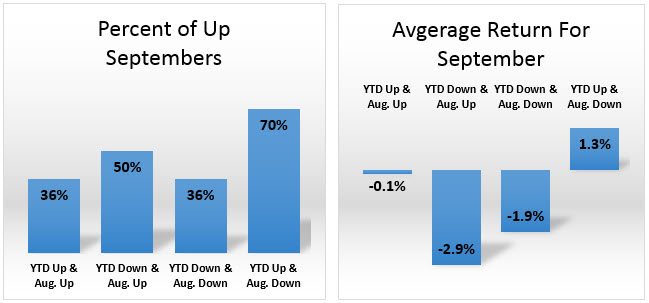
These stats are all illustrated in the graph below with the green bar representing this year’s current condition. This year the S&P 500 ended August up +6% YTD, and August closed down -.09%.
The pattern here makes a lot of sense. In years that have been strong up to August, and then August corrects, September has a strong tendency to continue the year’s uptrend.
So don’t fear September for September’s sake, like the Wizard of Oz who presents himself as a monster until his real personality is revealed...
September is just another month which is willing to play nice with the trend.
So use the method of following Mish’s Economic Modern Family and Keith’s weekly Market Outlook covering the market’s internals to establish your bullish or bearish bias.
Both Mish and Keith will be back this week.
I hope you’re enjoying the Labor Day holiday!
Best wishes for you trading,
Geoff Bysshe
President
MarketGauge.com
*For the full report by Yardini Research, Inc go here.

Every day you'll be prepared to trade with:


