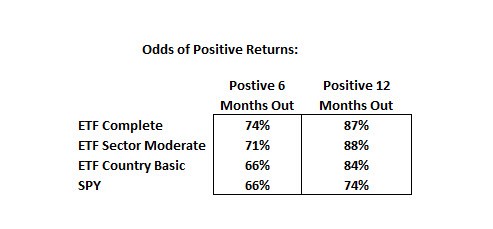
The table above shows the odds of achieving a positive return over any 6 and 12 month time periods if you started an ETF portfolio or bought the SPY during any random week between 2007 and the recent 12-month periods available. The data doesn’t get into the magnitude of the gain or losses over the period or what kind of drawdown you might have had to sit through, which is important, rather it is merely asking the odds of a positive or negative return over the holding period.
Historically speaking, if you picked any week at random during the past 10 years or so, you would have had a 74% chance of a positive return 6 months out and an 87% chance of a positive return 12 months out trading the ETF Complete model. This is higher than the 66% and 74% chances respectively for holding the SPY over 6 and 12 month periods (note that the SPY is also greater than 50% showing that there is also some positive bias in the broader market over the last 10 years, though the ETF models all have a stronger bias than the market).
The high odds of a positive outcome when randomly choosing when to start a portfolio should be reassuring. Profitable trading of the ETF models doesn’t rely on perfect market timing or good luck. But there are still more layers. What if the model just put in a new high or is coming off a period of weakness? Next week we will wrap up this series looking at the performance differences coming off these levels.