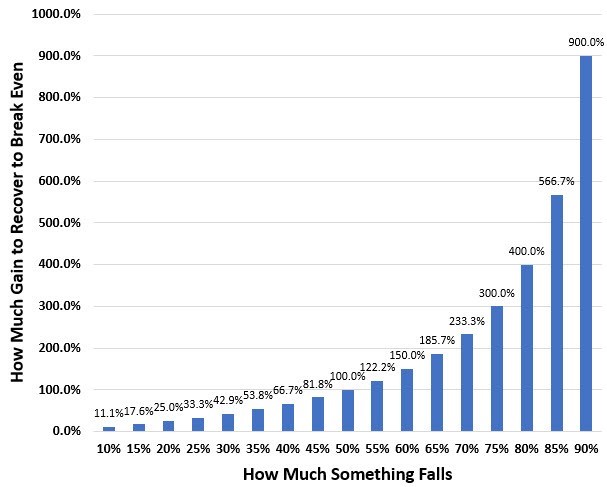
The chart above shows the different values you need to get back to even (vertical axis) based on the how much the original decline was (horizontal axis). You can see as the decline gets larger, the percentage amount needed to get back to even gets larger at an increasing rate. While you only needed 11.1% after a 10% decline, you need 900% after a 90% decline.
It might not be immediately apparent, but we have just stumbled on one of our potential sources of decay (I say “potential” here because not all return scenarios decay, this can also work in your favor to amplify your returns!).
It might be easiest to demonstrate with an example…
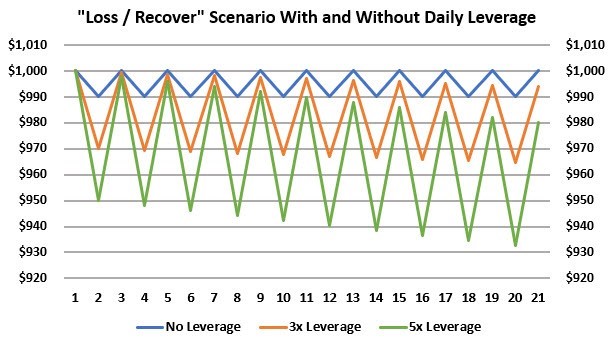
If we set up a scenario where a stock valued at $1,000 goes down -1% on the first day and then goes up +1.01% the second day, after the two days, we are back to our starting value. If this sequence of returns repeated itself 10 times, after the 20 days, we would still just end up with a stock worth the same as we started with, $1,000. We deliberately chose values so that the starting and ending value were the same.
Now let’s add some leverage…
If we applied 3x daily leverage, we would just multiply the up and down percentages by 3. So, on a down day, it would go down -3.00% and on an up day, it would go up +3.03%. With 5x, that would be -5.00% and +5.05%.
However, if something goes down -3.00%, it actually needs to go up +3.093% to get back to even, not just +3.03%. Likewise, for the -5.00% decline, it has to go up +5.263% to get back to break even, not just 5.05%.