Market going through a midlife something-I do not want to write the "C" word. Although, I am compelled to say SPY back in a Bear Phase.
SPY: 121.00 is the top of the candle from 11/29 before the gap higher …
Seeing a lot of oversold indications on the 2-Day RSIs as NASDAQ (QQQ) and Midcaps (IWM) as both indices fill gaps to negate an island bottom whilst S & P 500 (SPY) did not. Volume was lighter than yesterday's. The …
FOMC and Market Disappointment
Today reminds me of an anxious child (the market) anticipating some great big surprise (From the FED) and when it doesn't happen (No Policy Change), throwing a bit of a tantrum (The Selloff). But, does that …
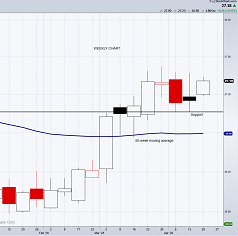
Looking at the S & P 500 (SPY) chart, the important number to hold is the upwardly sloping 50 DMA. That would keep the island bottom and phase intact. Furthermore, the monthly moving average comes in right there as well.…
"Sarkozy smiling as he leaves the EU meeting." Twitter entry last Friday. He must have known that NASDQ would end the week with a Golden Cross and its 4th Accumulation Day in volume. Now, everything is lined up-the moving averages, …
And just like that, no more overbought conditions in the indexes! While the EU dance around with one another, let's look at my favorite indicators:
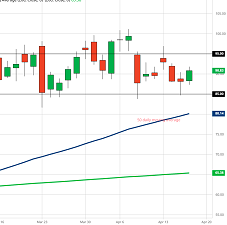
SPY: Bye bye 200 DMA for now. Hello the Exponential Moving Average. No change of …
4 Accumulation Days in volume and a close above the illustrious 200 DMA in S & P 500. Officially overbought on the 2-Day RSI but not on the weekly or monthly. Midcaps (IWM) on the other hand, had a distribution …
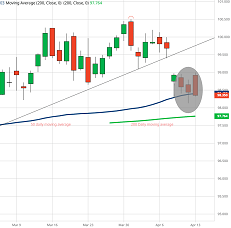
Inside day in S & P 500, NASDQ and almost Russells (took out prior day low by a few ticks). Placement of the inside day especially in SPY most fascinating-tickling the 200 Daily Moving Average. Did not do enough correcting …
But wait... bank intervention followed by a review for a downgrade in Europe? New intraday highs followed by new intraday lows. Feeling your strings pulled? S & P 500 dropped her handkerchief in front of the 200 DMA; then when …
What truly amazes me is where the S & P 500 (SPY) ended. After the 10th biggest winning week since 1950, you'd think there would be some clarity. But NO! S &P had to close with a crap shoot chart. …

Mish in the Media
View Mish's Media Highlights

New to Mish's Daily?
Discover Mish's Economic Modern Family

Mish's Articles
View Mish's article archive