April 5, 2016
Mish's Daily
By Mish Schneider
A New Candle Pattern!
Today's commentary was written by Geoff Bysshe, co-founder of MarketGauge.
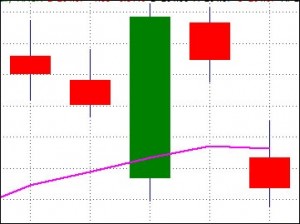
The last 5 days in the SPY and QQQ have created a rather interesting pattern on candle charts (see above).
It caught my eye today, and couldn’t help but quickly scan the last 10 years of daily SPY data for a similar pattern. I was looking for two small range days engulfed by a big range day, followed by two small range days within the big range day.
I only found one situation that was similar, and it concluded on Dec. 18th 2013.
However, I consider it to be different because the first two small days are near the bottom of the 5-day range and the last two days are near the top of the range, so there is clearly a bullish progression there that does not exist in the current 5-day pattern.
So this is a first.
I’m always looking for the first time a market does something after a significant time since the last occurrence, because it tips me off to what may come next, but a real first, one that has no historically precedence, really doesn’t help, unless…
You use it to realize that you can’t use it, and therefore you need to look for something you can use rather than getting too consumed with the market’s minutia!
In other words, every day’s pattern is not necessarily worth focusing on. Be careful of what you “think” you see in the charts.
I think the last five day pattern looks cool, and I even think it represents a very confused market with no conviction to move either way. Unfortunately, it’s not a pattern I can say has any predictable outcome.
This leaves me with the same basic thoughts I’ve shared for the last two days. The general market’s trend is up but choppy, and until the indexes take out Friday’s low and the 10-day moving average, and then continue lower, I’ll expect the choppy uptrend to continue.
However… There are a few reasons for the bulls to be concerned if the market continues lower tomorrow:
If I add it all up…
I’d be very cautious if the SPY and IWM break tomorrow’s 30 minute opening range low if it’s under today’s low.
If the market trades over today’s highs its complacent and confused bullish bias could enable it to rally, but I’d wait for that line to be crossed before I look for the rally to resume.
Focus on the industry groups that are well positioned for trades – don’t over think the general market here.
S&P 500 (SPY) Sitting at an important inflection point. Follow the direction that breaks Tuesday’s range.
Russell 2000 (IWM) Bearish if it continues lower on Wednesday. Not bullish until it crosses over 110.
Dow (DIA) I’d still use Friday’s range 175.41 – 177.85 as your barometer of this market’s direction. The 176.50 area could be resistance.
NASDAQ 100 (QQQ) Use Friday’s range 108.39 – 110.40 as your barometer of this market’s direction. There should also be support 107.75.
XLF (Financials) Important support is 22.10, and needs to clear 22.80 to breakout of its range.
KRE (Regional Banks) 50 DMA is finally turning up and sits at 36.50. Between that level and 33.83 it’s stuck in a range.
SMH (Semiconductors) A move under Tuesday’s low of 54.41 is bearish. Look for support at 53.70. Needs to get over Tuesday’s high of 54.81 to consider longs.
IYT (Transportation) Closed under key level of 139.50, and back under its 200 DMA. Bearish until it can close over 140. This could be negative for the general market.
IBB (Biotechnology) Healthy consolidation today. If market gets weak look for it to hold 164. If the market rallies this could be time to enter if it breaks 272
XRT (Retail) Bearish action continued like IYT, and now closed under 200 DMA. This could be a warning of market weakness to come. It stopped at the expected support at 45, Next key support is 44.60.
IYR (Real Estate) Still looks poised to run if it can break 78. The key support level to hold is 77.00.
ITB (US Home Construction) Held up well after lower open, but in a weak position. Use Tuesday’s range to determine bias of next move.
GLD (Gold Trust) Closed over the 10 DMA after Friday’s low touched the 50 DMA for the first time since January. Follow through tomorrow over Tuesday’s high would be bullish within the big range of 115-122 which is the range to break one way or another. 119 is a significant resistance level.
SLV (Silver) It needs to get back over 14.50 for me to be bullish again, but the 14 area may be good support and is the area of the 100 DMA.
GDX (Gold Miners) Nice close over the 10 DMA and prior day, but still range bound at 18.50-21.00, and March led to a well-defined wedge suggesting the next move may come soon. Breakout over Tuesday’s high may be one to follow. Relative to its 50 DMA it has held up better than GLD.
USO (US Oil Fund) Quiet day after yesterday’s break of its 50 DMA at 9.30. Key levels to watch now are 9.60 to break higher and 9.00 as support below its current level. Oil inventory data on Wednesday could create a big move either way.
TAN (Guggenheim Solar Energy) Sitting right on key support! Since January every multi-week turning point and move has been very correlated with USO. Both now sit at good levels to form a swing low, but they need to turn up first! 21.50 in TAN is the key level for it to hold.
UUP (Dollar Bull) 24.40 has been a big support level since May of 2015. A break below it would be a major breakdown. May consider long position if closes and continues over the 10 DAM but that’s days away most likely.

Every day you'll be prepared to trade with:


