September 10, 2017
Mish's Daily
By Geoff Bysshe
 For the Economic Modern Family, Friday was not much more than a continuation of the consolidation that had been goin on since Tuesday.
There were some notable exceptions like IYT which had a strong day on Friday, closed of the day and the high of the week and over its 50-DMA.
Acually, a strong Friday is quite normal for IYT. As you’ll discover below, IYT has a history of doing well on Friday, especially when it closes up on Thursday.
The other notible deviant from a week of consolidation was KRE which spent the week falling. Though major support.
Since Friday was quiet, I’ve decided to share some stats that I like to watch that track which instruments tend to trade higher on certain days of the week.
It’s not a magic bullet, but it is fun and informative.
These stats answer questions such as:
When building mechanical systems we like to start with some kind of statistical edge. We haven’t built a “day of the week” system yet, but I like to look at this data and focus on the extremes.
For example, I mentioned above that IYT has a strong tendency to close up on Fridays. As you see in the data below, based on the last 40 weeks, IYT closes up on Friday 69% percent of the time, and 71% of the time when Thursday was an up day!
Here’s a summary table. I’ve include the Economic Modern Family ETFs plus the SPY, QQQ, TLT and FB (for fun and because this is one of the stocks I suggested a trade on for MMM Advantage members next week).
Table 1 below, “Percentage of Days That Closed Up”, shows the percentage of times the instrument closed up vs. the prior day for each day of the week and then “All” represents all days combined. The data includes the last 40 weeks.
The color shading simply highlights extremely high percentages in green, low in red and insignificant in yellow shades. I’d focus on the red and green boxes.
Here’s where the fun starts…
I’ve highlighted two example of interesting patterns with red boxes.
The table shows that the QQQ has closed up 69% of the time on Mondays. So which would you rather trade on the long side – the QQQ which is up 69% of the time or the TLT (look at the last row) which is only up 47% of the time?
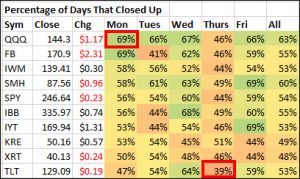
Additionally, I’ve highlighted with a red box, the TLT on Thursday’s because they’re only up 39% of the time! Another way to look at this is that they are DOWN 61% of the time on Thursdays.
So don’t buy the TLT on Wednesday unless you’re ready for a down day on Thursday!
Now you know how to read the table, and you can see more interesting days like…
And then it gets better…
What if you consider whether the prior day was up or down?! In the table below you’ll see the same stats (% of up days), but calculated only when the prior day was UP.
This table is sorted by the symbols that were up the most on Friday, and then by the performance on Monday’s.
I’ve highlighted the symbols to focus on because they are ones that have stats that apply to Monday – they closed UP on Friday.
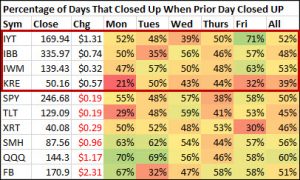
The stand out her is that KRE was up on Friday, and based on the last 40 weeks of data, it only has a 21% chance of closing up on Monday. In other words, there is a 69% chance it will be down on Monday!
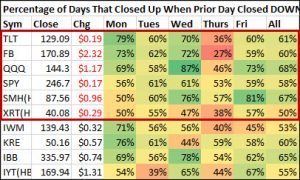
So next is what about the stats on when instrument were up the prior day (in this case on Friday)…
I’ve highlighted the symbols to focus on because they are ones that have stats that apply to Monday – they closed DOWN on Friday.
So now it gets interesting!
TLT, FB, and QQQ all like to close up on Mondays!
Additionally, if they have down Wednesday’s, Thursday’s don’t look like a good day to be long J.
Don’t worry….
If Thursday is a down day in QQQ or SMH then you have great odds, 73% or 81% respectively of Friday being an up day.
That could come in handy if you play weekly options with only one day to expiration when you get massive percent changes in weekly option values with very little price changes.
The next step would be to do the same quick analysis on the situations where the market had a down prior day, or a gap (up or down) into the current day.
I also look at the stats that compare the open of the day to the close.
As I said above, it’s not a proven trading system (yet), but it gives us information that’s an edge and fun!
If you like this type of market insight, and would like us to provide more let us know. Just let us know what you like most, and what you’d like to see changed about Mish’s Daily and MMM Advantage in the chat window / email at the bottom of this page of the next one
S&P 500 (SPY) Consolidation day. Look for support at 245.75. Resistance at 247.30 and then needs to close well over 248 to get going, and watch the all-time high of 248.91.
Russell 2000 (IWM) Consolidation day. Still in Warning Phase. 138.45 is important support to hold and then 137.25 and 136.25. Resistance at now at 140.70 and then 142.30.
Dow (DIA) Consolidation day. Closed under 10 MA for last three days with support at 216.60. Resistance at 219.50 and then 220.
Nasdaq (QQQ) Weak day, but still consolidating. Look for support around 143.60 and 142.40 Resistance is at 146 and then the highs at 146.60.
KRE (Regional Banks) Paused but still in a major breakdown after closing under 51. Negative until closes over 52. No support until 46.50
SMH (Semiconductors). Weak day, but still consolidating. Sitting on the 10-DMA. Look for support at 87 and breakout above 88.90 for possible assault of new all-time highs
IYT (Transportation) Great strength on the day and closed over the 50-DMA but still consolidating between the 200 and 50-DMAs Look for support at 166.40 and resistance at 170.
IBB (Biotechnology) Very Strong sector with nice compression at highs Breakout above 336.80. Support around 330-328.80
XRT (Retail) Much awaited breakout over the 50-DMA with confirmed recovery phase. Should hold 39.75. Resistance around 40.75
IYR (Real Estate) Strong day. Needs to clear 82 for clear sailing and hold 80.60
XLU (Utilities) Nice move high after recovering back over 10-day MA. Support at 54.40 and 53.60. Strong sector that is outperforming SPY.
GLD (Gold Trust) Breakaway market. Support at 126 and 125 and resistance at 131
GDX (Gold Miners) Now one of the strongest groups and plenty more upside. Look for support at 24.45. Expect a little resistance at 25.70 and then more at 28.25
SLV (Silver) All metals on move with yields dropping. Look for support at 16.80 then 16.30-.20. Big resistance at 17.50.
USO (US Oil Fund) Big drop is a good example of what can happen when markets fall back into gaps, but held support that was expected. It’s still following the pattern of a major bottom. Should hold 9.60, and must hold 9.30. Big resistance at 10.25.
UNG (Natural Gas) Sitting on key support of 6.40. Be patient. Here’s what has been written here for weeks… “Still in a bear trend according to phases. If it has a 30-min Opening Range breakout over 6.75 -6.90 it could indicate a longer-term bottom. The all-time low is 5.78, the weekly base high is 9.80. So the risk is just over a $1 and the first target is just over $2, but if it breaks $10 then $12 is the next stop.”
KOL (Coal) Consolidation day above 10-DMA and multi- year highs Look for support at 14.90-.80 and breakout above 15.45
TAN (Solar Energy) Pulled back from 22.00 resistance and 21.00 support. That’s all you should focus on.
TLT (iShares 20+ Year Treasuries) Consolidation day. 129.16 is a pivotal level. Friday’s low (127.69) is pivotal for short term and 126.40 would trap fresh bulls. Gap fills at 129.60 from last November.
UUP (Dollar Bull) Appears to be in a free fall. Important support at 23
FXI (China) If it can hold over 43.40, the long-term picture is beginning to look like an accelerating breakout. Support at 43.40 and 42.75. Next resistance is 46 - 46.50
EWW (Mexico) Trying to hold swing low from mid-August 50-DMA. 55.40 is support it must hold.

Every day you'll be prepared to trade with:


