October 4, 2020
Mish's Daily
By Mish Schneider
 Written by Forrest Crist-Ruiz
Our president and first lady contracted covid. That yielded a morning gap down, followed by a rally. That rally was partially based on hope for the stimulus.
These are some of the biggest thoughts on traders minds as of Friday.
And of course, on everyone’s mind is the thought of what I should do next?
If you’re unsure of what to do, days like these can be good to sit on the sidelines, but if you want to put on a position, it can be very useful to time your entry into the market.
What I mean about market timing is lining up your trade entry with the major market indices.
This can help you get a better price on your entry and keep you on the right side of the market.
It’s also very easy to set up and the basics are easy to grasp.
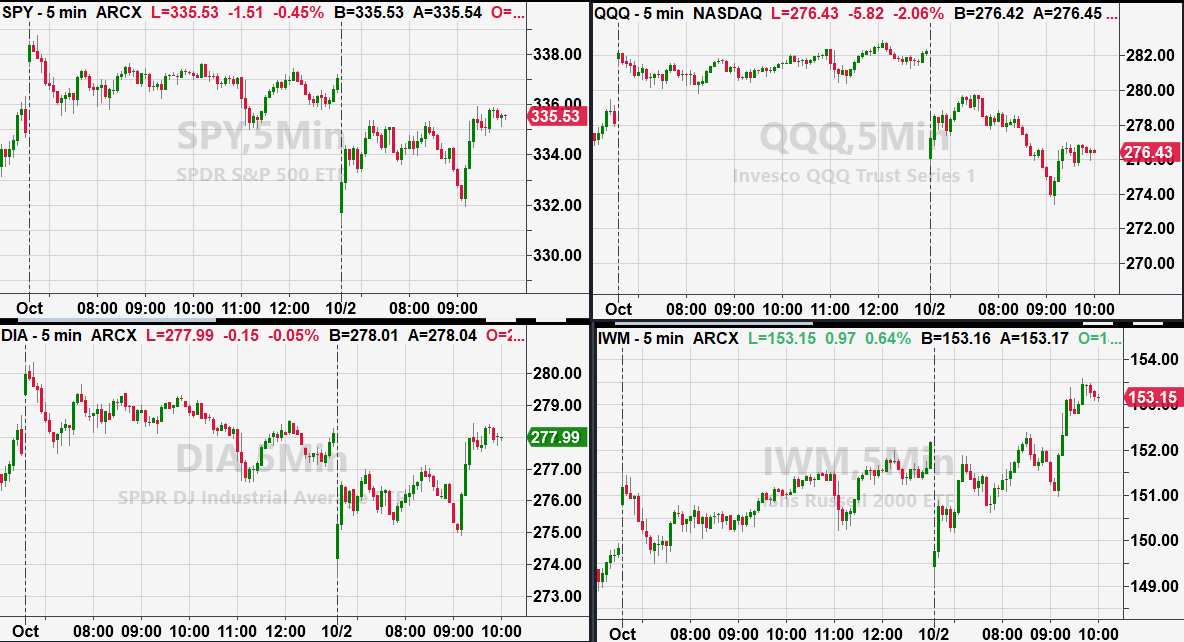
Here we have the SPY, QQQ, DIA. and IWM. These are ETFs of the 4 major indices.
We will be using 5 minutes charts meaning each individual red or green bar you see represents 5 minutes.
The vertical dotted line shows the divide between last Thursday and last Friday.
One important piece of information to keep in mind is where the current price is compared to the high/low of the day before.
This can give you a good sense of the market's strength or weakness comparatively to the current day.
For instance, breaking above Thursday's high is a bullish sign, and if multiple indices were to do so, that could be a great spot to enter a trade.
Conversely, if the market is breaking below Thursday’s low and you see a stock you want to trade, it could be wise to wait until there are signs of the market finding support.
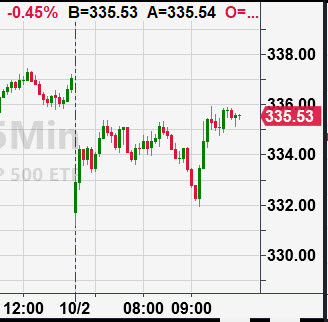
A little after 11:00 AM ET on Friday, you can see all 4 found support. SPY looked the strongest at that point, when the low from the initial open became the support for price. However, by the end of Friday’s session, although SPY held the lows, the rally stopped just shy of clearing the 50-DMA or $335.00
Conversely, IWM broke out above Thursday’s high. An interesting rotation, IWM also managed to clear the 50-DMA. Once IWM began to lead the pack, trading opportunities in that index or in various stocks in the IWM basket.
The NASDAQ 100 or QQQs were weakest by evidence of a new intraday low in the middle of the session, while the SPY, IWM and DIA held their initial lows made on the open. What that told us was that tech was particularly weak and definitely not presenting with any kind of buy opportunity.
Using 5 minute charts can be a helpful tool to either keep you sidelined or give you a good signal if it clears the prior day’s highs like IWM did.
Shorter timeframes on big gap opens can help you time your trades better.
Make sure to check out Mish on Yahoo Finance.
And to see and hear her top Lucky 13 picks, click the Youtube link for this week’s StockchartsTV segment.

Russell 2000 (IWM) Closed just over the 50-DMA. Needs a second close to confirm bull phase.
Dow (DIA) 273 Support. Resistance 280
Nasdaq (QQQ) Back into an unconfirmed caution phase with 275 the 50-DMA to get back above.
KRE (Regional Banks) Finally a strong close over 36. 38 is the next major resistance level.
SMH (Semiconductors) 181 resistance. Needs to hold the 50-DMA
IYT (Transportation) Held Support at 193 and also closed green on the day. 200 Pivotal.
IBB (Biotechnology) Needs to clear back over the 50-DMA. 137-138 Resistance 133.25 support.
XRT (Retail) Strong day confirming the bullish phase.

Every day you'll be prepared to trade with:


