October 9, 2017
Mish's Daily
By Mish Schneider
 Last week, I dedicated a lot of the Daily commentary to what I believe could be the hedge of the century.
Talk about a protracted bear market, the ratio between the performance of commodities versus stocks has only been this low twice in the last 100 years.
Interestingly, tuning in to this ratio right now aligns with a more esoteric concept:
The astrological prediction that, “Serious setbacks towards October will bring a long-term bearish market as there is no more fire years before the Tiger year 2022.”
An easy way to track how many commodities are currently performing starts with understanding weekly trends.
How can two simple moving averages work so well?
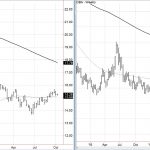
DBC, the ETF for the Commodity Tracking Fund, holds in its basket 14 commodities.
Heating Oil, Brent Crude Oil, Gasoline, Sweet Crude Oil and Gold make up the top five holdings.
DBA, the ETF for agricultural commodities, holds in its basket Soybeans, Cocoa, Coffee, Wheat, Live Cattle, Sugar, Corn, Hogs, Cattle Feeder and Cotton.
The DBC weekly chart sits above the dotted line or the 50-week moving average. That puts it in a weekly recovery phase.
The DBA weekly chart sits below the dotted 50-WMA. That puts it in a weekly bearish phase.
In DBC, support at the 15.09 or the 50-WMA should hold if this is ready to move higher.
Should oil (the ETF USO remains below its 50-WMA) rally, then DBC will fly.
In DBA, the story looks much weaker for now.
Having made a new all-time low just 6 weeks ago, this must prove it can keep from selling off any further. Plus, it must begin to show signs of strength.
If DBA can clear and hold above 19.20-25, that’s a start. However, the real fun will not begin until it can clear the 50-WMA now at 19.83.
When commodities run hot, they sizzle. For that reason alone, patiently waiting for price and phase confirmation will keep you from running into these trades too fast.
As far as equities and the other side of the hedge goes, some troubling signs emerged during the slow bank holiday session. Please see below.
S&P 500 (SPY) Nothing day
Russell 2000 (IWM) 150 now pivotal. Did close with a reversal topping pattern if confirms with a close under 149.18 Tuesday
Dow (DIA) Meh-nothing to discern from today’s action
Nasdaq (QQQ) FANG always seems to be the last to know the rally is over if this breaks below 147.30 and closes there
KRE (Regional Banks) 56.00 must hold and 57.26 next place to clear
SMH (Semiconductors) Gapped higher. Exuberance runs amok
IYT (Transportation) 175.75 should hold if this is going to sustain the recent highs. Closed weak and under the 10 DMA. Last time that happened it sold off form almost a month
IBB (Biotechnology) 340-343 resistance with now 337 pivotal support.
XRT (Retail) The weak tend to get hit first. Granny better hold 40.00
IYR (Real Estate) I would not want to be long under 78.00
XLU (Utilities)
GLD (Gold Trust) Gapped up and held. 123.10 the 50-DMA to clear
SLV (Silver) Confirmed the reversal pattern and should hold Friday’s lows now
GDX (Gold Miners) Confirmed bullish phase if holds 23.50
XME (S&P Metals and Mining) 31.60 key support
USO (US Oil Fund) 9.80 support. I still like this longer term, especially since went back into an unconfirmed recovery phase
XLE (Sel Energy Spdr Fd) Inside day under the 200 DMA
OIH (Oil Service Holders) 25.40 held
TAN (Solar Energy) 21.00 major support to hold. Resistance at 22.00.
TLT (iShares 20+ Year Treasuries) 123.87 pivotal 122.60 support and 124.55 resistance
UUP (Dollar Bull) 24.30-40 big area to hold/clear and 24.00 pivotal support
FXI (China) 45.00 support point to hold

Every day you'll be prepared to trade with:


