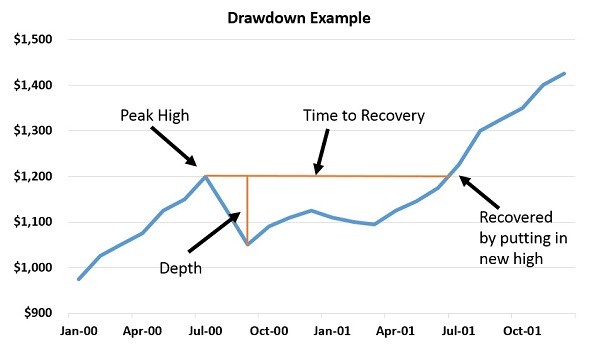
In the example above, the equity puts in a new “peak” high at $1,200 in July. Over the next couple of months, the equity sells off down to about $1,050. This happens to be the lowest it sells off to before it puts in a new high a year later, but we cannot declare that low as the maximum “peak-to-trough” drawdown until we see it put in that new high. The time to recovery is simply the length of time between when the equity puts in a peak high and then finally puts in a new high.
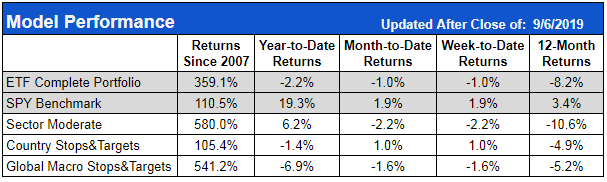
The frequency and severity of drawdowns can play a big role in how hard or easy it is to stick with a trading system. Frequent, deep drawdowns can test your resolve to stick with a longer-run winning system. Expectations also play a roll. If you go into a trade expecting a particular or high level of volatility, you can risk and position-size accordingly and stay with the plan.
Drawdowns in Popular and Trending Stocks
The main issue with drawdowns is you never know for certain how far they will go down and when or if they will ever go back up. There might be a reasonable expectation that when a previously profitable and well-run company hits a snag, it will eventually be able to right itself, but there are no guarantees.
Drawdowns present us with the same old “fear” vs “greed” conundrum. The main fear is that stock will keep going down and you could lose significant capital. On the other side, if you sell now, you might take a loss and miss out on any potential upside should the stock bounce back.
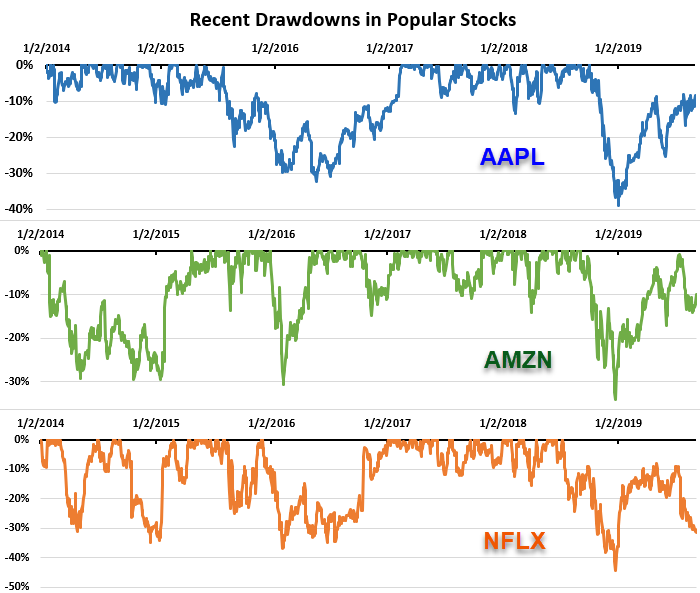
Apple, Amazon, and Netflix have been some of the strongest stocks over the last couple decades. These companies have pioneered new technologies, products and services that have defined modern technology, entertainment, and commerce—and they have all been well rewarded by the market with huge price and capital appreciation over that same period.
Even still, holding these stocks is not always a picnic. In addition to their wild returns, they also have wild volatility and drawdowns. Netflix wasn’t around for the dot-com bust in the early 2000’s, but Apple had a -81% drawdown and Amazon was down -94% during that period. In the 2008-2009 financial crisis, Apple was down -59%, Netflix was down -51%, and Amazon was down -65%.
And you don’t just need a financial crisis to see this volatility. In recent years, even as these tech giants have been pushing to new all-time highs, we have seen some serious corrections. Just last fall, AMZN had a -34% drawdown, AAPL had a -39% drawdown, and Netflix topped out with a -44% drawdown.