August 12, 2018
Weekly Market Outlook
By Geoff Bysshe
 Last week JP Morgan’s Jamie Dimon, suggested that investors were too complacent with their outlook for interest rates remaining lower for longer, and that we should be prepared for a 5% rate on the 10-year U.S. Treasury.
As you can see from the chart below the 10-year is currently trying to break the 3% level (red line) which in 2014 stopped the first rally from its historic lows in 2012.
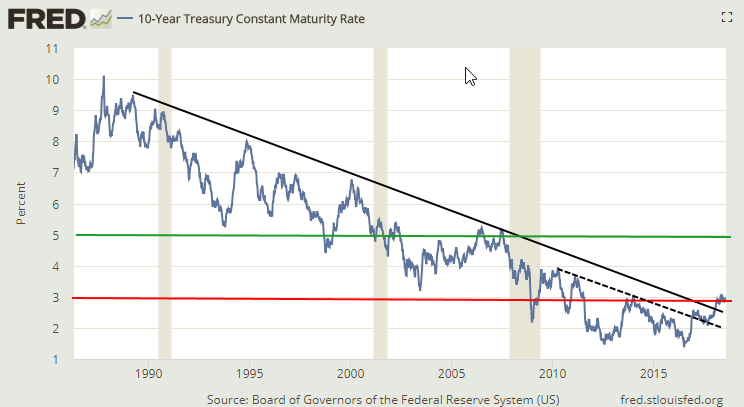
The basic technical set up looks like 5% would not be that hard to reach so long as it can get through some very formidable resistance at 4%.
But I doubt Mr. Dimon is basing his prognostications on a chart like the one above. Especially since he also suggested that the bull run in stocks could have 2-3 more years to run!
Perhaps he’s reading the work of renown investment strategist Ed Yardeni who recently reported in one of his recent blog.yardini.com posts that, “The Bond Vigilante Model suggests that the 10-year Treasury bond yield tends to trade around the growth rate in nominal GDP on a y/y basis.”
In case you’re wondering…
“The term “bond vigilante” – coined by United States investment strategist Ed Yardeni in 1983 – describes how markets act to safeguard the economy when governments and central banks have not.”
- ezonomics.com
In other words… markets will do what they want regardless of what the Fed or the President says!
The chart below is the one that Mr. Yardeni used to support his point.
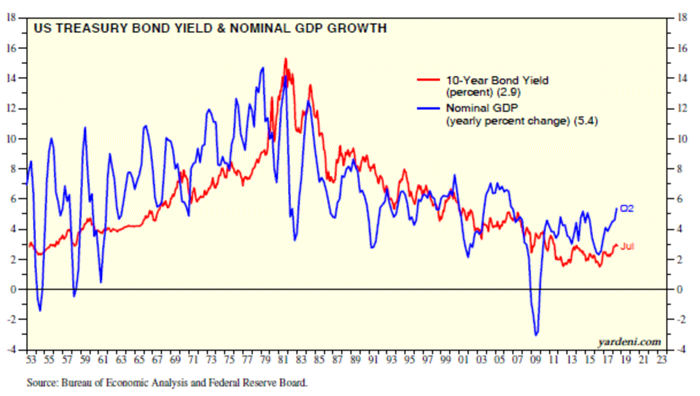
With all due respect to Mr. Yardeni, the two lines on this chart are rarely at the same point as his quote suggests!
However to my eye, there is a very clear pattern of correlation that does support his point, and it works as follows.
Nominal GDP tends to pull the 10-year in the direction of its trend, and this pull is more influential when the rate of nominal GDP is above and trending higher, or below and trending lower, than the 10-year.
For example, currently, the rate of growth in nominal GDP is above the rate of the 10-year and it’s trending higher. This is the most powerful condition in which the 10-year should be pulled higher.
Since Mr. Dimon believes that economy will continue to expand, it’s a logical conclusion that with the current rate of growth at 5.4% the 10-year at that same level is not far behind.
Are you ready for a 5% rate on the 10-year?
Economics is fun, but its timing is notoriously terrible. So consider everything you just read a ‘long term’ outlook.
Let’s take look at what happened last week
The TLT ETF shot higher. Which means 10 and 20 year rates went down!
This was likely due to a ‘risk off’ attitude in markets as Turkey’s economic stability was threatened, questioned, tested, etc.? You decide.
Its currency collapsed in part by President Trump’s call for increased tariff on their steel and aluminum imports.
“Trade wars” have been brushed off by stocks for the most part, but this time stocks didn’t rebound.
Why not?
If we take a look into the Big View charts we can see that stocks are vulnerable in the short term.
Here’s why.
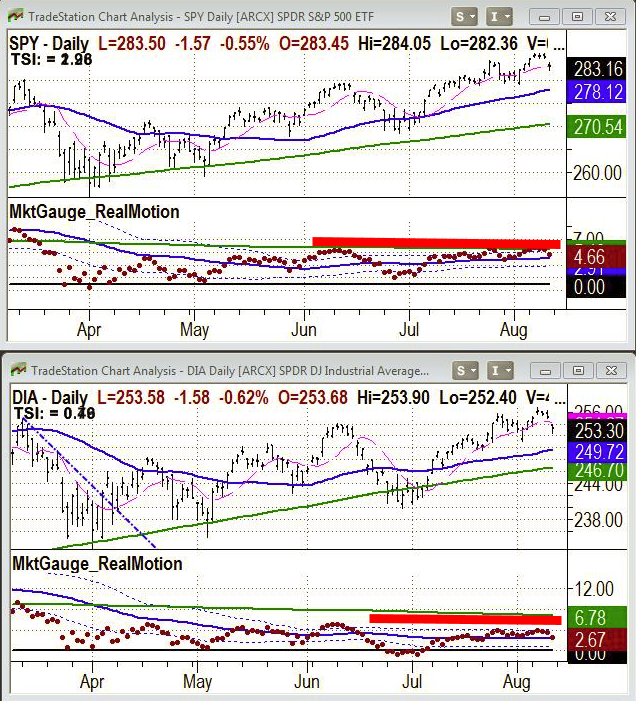
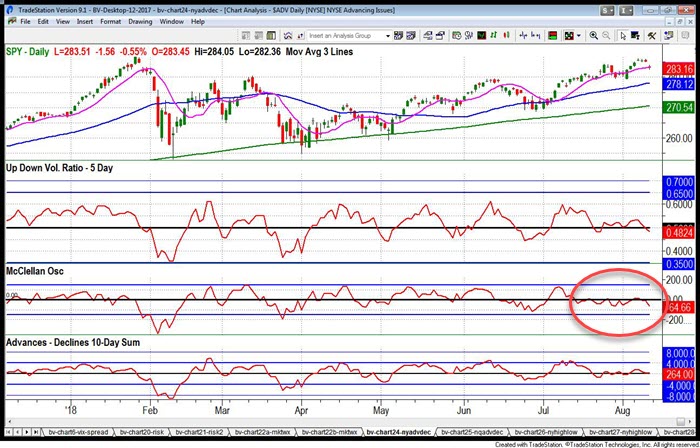
If you look at the NASDAQ chart with the same indicators, you’ll see a very similar picture of weakness.
Additionally, the New High/Low Ratios for both NYSE and NASDAQ are weak.
And there’s more…
If you’re an Alpha Rotation member with access to Big View Premium, keep reading here, because there are some important developments in the areas of Sentiment, Interest Rates and Currencies.
In summary, momentum is slowing, market internals are weak, complacency peaked, and the bond and currency markets are reflecting a move toward a Risk Off environment.
At this point, however, the bearish conditions are in the shorter-term measures.
Consolidation or a sell-off would be productive but should be should be treated with caution. The long term momentum and trends are still bullish so if the Turkey scare is dismissed by a rising market next week then it could be followed but with caution.

Every week you'll gain actionable insight with: