May 18, 2026
Weekly Market Outlook
By Geoff Bysshe

There’s a saying on Wall Street, “Strong Convictions Loosely Held.”
After a historic short-term move fueled by a much anticipated and better than expected earnings season, investors will be looking for the market’s next clear narrative.
Let’s look at why this process may be about to challenge the convictions that have kept investors holding tight up to this point.
The Stock Market’s ‘Party’ Is About To End
The party I’m referring to here is earnings season, NOT the secular bull market.
Earnings season was an easy answer to why stocks would rally despite the war with Iran. Expectations of strong earnings enabled the bulls to maintain strong conviction amid frightening geopolitical events.
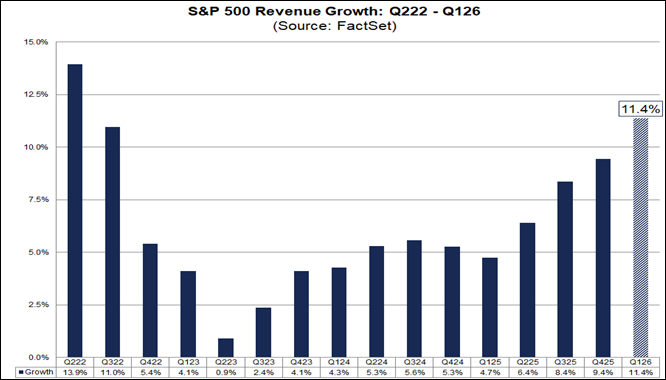
Corporations delivered the best revenue growth in 4 years.
According to Factset, “At this late stage of the earnings season, the (blended) revenue growth rate for the S&P 500 for Q1 is 11.4%. If 11.4% is the actual growth rate for the quarter, it will mark the highest revenue growth rate reported by the index since Q2 2022 (13.9%).”
Earnings have been equally impressive. Earnings growth is on track to be 27% for the quarter, and according to Factset, “If 27.7% is the actual growth rate for the quarter, it will mark the highest earnings growth rate reported by the index since Q4 2021.”
2026 has had a remarkable setup for momentum investing in that the stocks that have been leading have good fundamental outlooks, and the price action shifted from strong leadership to parabolic without a hiccup.
As a result, if you have had strong convictions about the AI trade and more specifically the accelerating growth story in the hardware segment, the trend has been historic.
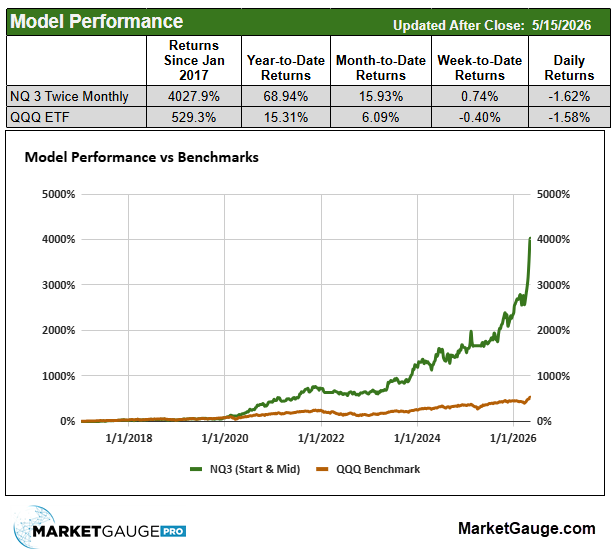
Our NQ3 algorithmic system has been trading the leading Nasdaq 100 stocks with the same rules since 2017, and as you can see by the chart of its performance below, leading tech stocks consistently outperform the QQQ, but the size of the move in 2026 is unusual.
With the tech feeling “stretched,” the temptation to call a top natural, and the price of sticking with the same strong convictions that enabled you to enjoy the ride up is high if a “normal” correction occurs unexpectedly.
The chart above demonstrates more than just how leading stocks can outperform over the long-term. While it’s not obvious from the chart, there are two other reasons that NQ3 System dramatically outperforms without using any leverage.
In short, you don’t have to pick the top to find the right time to take profits prudently, or choose between being “in or out”, and the market will rotate even within the tech sector, providing new opportunities.
Investors are still looking forward to several high-profile earnings reports like Nvidia, but the earnings season, which has fueled a party atmosphere, is winding down.
This is likely to create some turbulence.
The Next Opportunities
Three primary market drivers have compelling conditions that could become the new market narrative.
The Economy
The strong and resilient economy has been on the bulls’ short list of reasons to remain bullish on stocks.
Bears suggest that a weakening labor market will crimp consumer spending. Since the consumer has historically been labeled as 70% of the economy’s demand function, weak consumer spending has been bearish for stocks.
This time may be different.
In February, a report about the economy by the Carson Group reported that, “On the hardware side, investment spending on IT equipment jumped by 28% in 2025 – for comparison, the 2010-2024 annual pace was just 6%. Within IT, spending on computers and peripherals grew by a whopping 72% last year (2025).”
As a result, the same report stated, “AI-related hardware (IT equipment) and software spending contributed 80 bps per quarter, i.e., about 36% of real GDP growth.”
Early readings of GDP growth in 2026 suggest that this area of the economy has risen dramatically.
According to the Bureau of Economic Analysis, Q1 2026 GDP grew 2.0% and is estimated to have grown by 1.3 percentage points, or about two-thirds of that growth, can reasonably be attributed to the AI buildout using equipment-plus-software as the proxy.
If the stock market embraces this trend as being a new normal, investors expecting stocks to be dragged down by weak consumer spending data by be left confused.
Put another way, by Jeffrey Roach, chief economist at LPL Financial, “Tech equipment continues to boost growth. The economy has more to go here if the late 90s is any guide.”
I agree 100%.
Interest Rates
If the stock market had its equivalent of kryptonite, it would be rapidly rising interest rates.
Interest rates that are too high and rising too quickly:
That’s a hat trick of bearish catalysts for stocks.
So the important questions are,
“Why are rates rising?”
“What’s too high?” and
“What’s too quick?”
There’s a health debate on both sides of “Why.”
And the answer could vary based on whether you’re considering short-term vs. long-term rates. Let’s cover short-term here because ultimately the Fed will be more publicly working to manage them with the Fed Funds rate, whether the debate leans towards growth or inflation.
The chart below shows a long history of the Fed Funds rate in blue (set by the Fed) following the market determined 2-year treasury note (red).
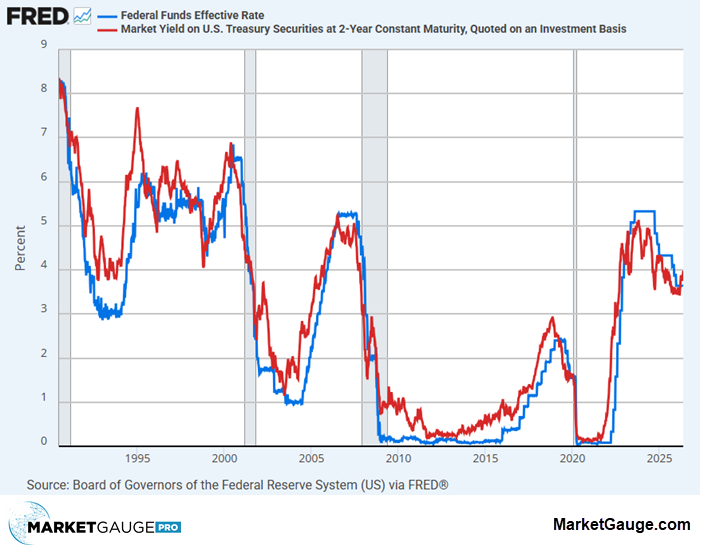
As you can see in the chart above, the 2-year has crossed over the Fed Funds rate which suggests the next move for the Fed will be higher.
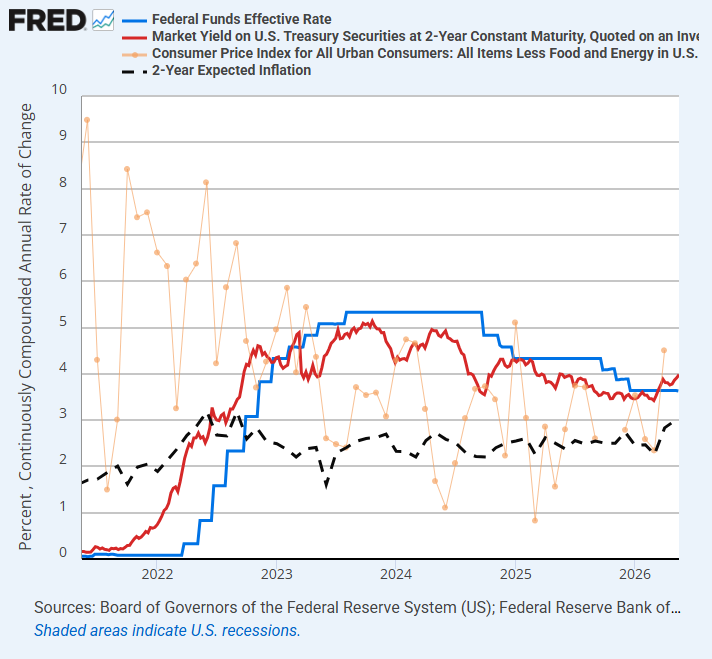
Below you’ll see the same chart zoomed in to more recent years along with the Core CPI and 2-year inflation expectations.
Core CPI is intentionally faint orange because it is volatile and less important than inflation expectations, as shown by the black dashed line.
As you can see in this chart:
This chart suggests short-term rates are responding to inflation data that suggests inflation is rising.
Long-term rates agree.
The chart below adds the 10-yr (orange) and 30-year (grayblue) treasury bonds to the view of the 2-yr vs Fed Funds.
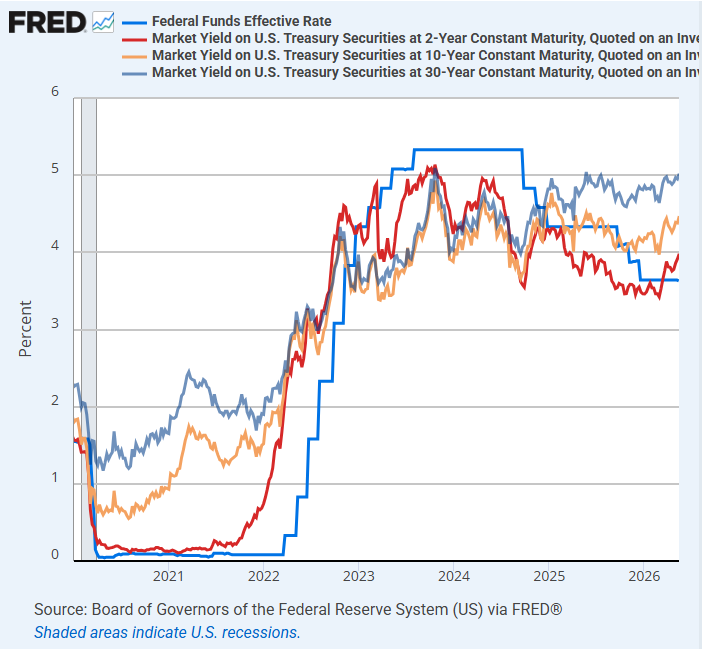
A few noteworthy conditions are:
When Are Rates Too High or Rising Too Fast?
Before jumping to conclusions based on just a few years of data, below you’ll find the trends in yields going back to 1990, because it’s popular right now to make comparisons to the Dot Com bubble.
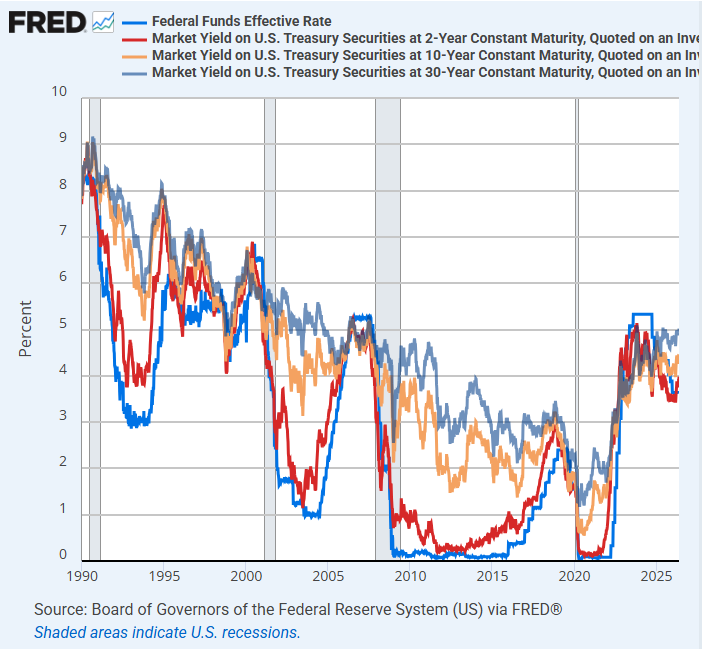
Are rates too high?
Economists can give you an econometric model to produce a result, which is still just a guess.
My trading experience answers this question in a more practical way...
Rates are a real threat to stocks when the following conditions exist.
To Be Continued….
This article will be continued tomorrow, right here.
We still need to look at market rotation, with a very timely example of it through the lens of a famous hedge fund manager placing a big bet on MSFT and funding it by selling his GOOGL!
 |
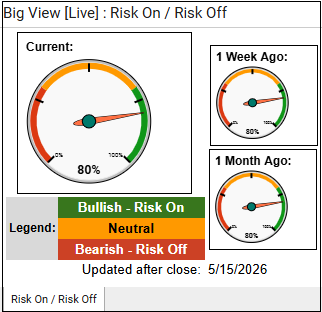 Every week we review the big picture of the market's technical condition as seen through the lens of our Big View data charts. Every week we review the big picture of the market's technical condition as seen through the lens of our Big View data charts.
The bullets provide a quick summary organized by conditions we see as being risk-on, risk-off, or neutral. The video analysis dives deeper. |
Summary: Markets paused after pushing to fresh all-time highs, with SPY and QQQ consolidating near record highs while small caps lagged sharply and several short-term indicators, including market internals and breadth, deteriorated beneath the surface. Despite continued support from low volatility, strong risk gauges, and leadership from growth stocks, rising rates, higher oil prices, and defensive sector rotation suggest the market may be shifting into a more cautious near-term environment.
Risk On
Neutral
Risk-off
Markets paused after pushing to fresh all-time highs, with SPY and QQQ consolidating near records while small caps lagged sharply and several short-term indicators, including market internals and breadth, deteriorated beneath the surface. Despite continued support from low volatility, strong risk gauges, and leadership from growth stocks, rising rates, higher oil prices, and defensive sector rotation suggest the market may be shifting into a more cautious near-term environment.
write an actionable trading plan based on these bullets
The market still appears to be in a primary bullish trend, but the deterioration in breadth, internals, and small caps suggests this is a time to become more selective and tactical rather than aggressively adding broad exposure. The focus should be on managing risk tighter beneath the surface while respecting that price and volatility have not yet fully confirmed a larger risk-off transition.
Equity Positioning
Tactical Approach
Risk Management
Volatility & Hedging
Macro / Cross-Asset Signals
Key warning signs now appear tied to:
If all three continue trending higher simultaneously, expect additional pressure on:
Sector Rotation Ideas
Potential relative strength:
Potential weakness:

Every week you'll gain actionable insight with:


